

Voter Fatigue
In the investment business, we have a term for that time when we just feel like giving up on a stock, simply because we’ve owned it for a long time: “investor fatigue.” There may not be anything fundamentally wrong with the company, but after several years of plodding, it just might kill you to own that thing for one more day. Initial expectations, no matter how realistic, have not been met and it becomes time for something new.
The Republican rout of the Democrats in the mid-term elections might very well have been a case of voter fatigue. Looking at the economic picture of the last six years does not show that our economy has failed to recover and that the policy decisions put in place have been wrong. Perhaps just plodding.
Take into consideration the following:
- Over the course of the President’s term in office, the stock market has more than doubled.
- Real GDP has grown (albeit modestly) every quarter since 2010.
- The employment picture continues to improve, with both unemployment and employment figures decidedly better today than they have been at any point in the last six years, and now at levels that are considered “normal.”
- The vaunted U6 Employment figure (including those “discouraged” workers), has come down a full six percentage points, and is within striking distance of normal historical levels.
- The most recent Job Openings and Labor Turnover Summary (JOLTS) from the US Government points to an increase in both job openings and hiring during the last several years—on pace for normal historical levels.
There is a serious argument to be made that even though the employment picture has improved dramatically, wage and income growth has not improved as much. While that side of the equation is true, it is also true that overall inflation has been very tame, and has not eaten away purchasing power. The Fed has recently said as much, suggesting that any increase in interest rates should have a bias towards a change in wage rate pressures, not just the rate of employment. In other words, despite the improving fundamentals, there are no signs of incipient inflation just yet.
Consumers, representing at least half of the economic activity in the United States, have been dealt another favorable trend by the recent sell-off in oil (lower prices at the pump) and the strength of the dollar (reducing the price of imports). Although both are likely transitory in nature, their positive impacts were quite strong in the months leading up to the election, and failed to turn any heads.
If you aren’t convinced that voters think they are better off, look at this chart of the Consumer Confidence Index®. It bottomed out just about the time the President took office, and has been on a climb ever since, approaching prerecession levels.
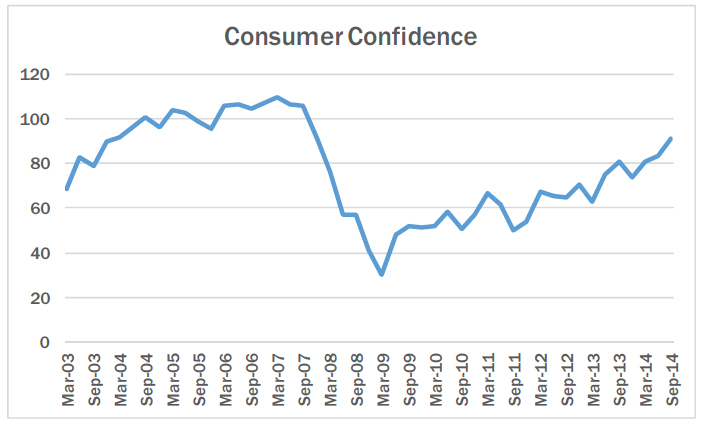
Confident consumers spend money. And spend they have. Automobile purchases, spending at restaurants, and on home improvement all indicate continued optimism this year.
Alas, the President’s approval ratings continue to sag, the Senate was handed back to Republicans, and the House has the largest Republican majority since the 1920s. Voter fatigue?
For us, as investors, the split in the Executive and Legislative branches will probably cause a more centrist approach to policy in the coming two years, which might actually be a good thing for stock valuations. We continue to seek out good performing companies selling for low prices—and we won’t suffer any fatigue in that mission.
We wish you a safe and happy holidays.
Sincerely,
Pacific Ridge Capital Partners

About Pacific Ridge Capital Partners
Pacific Ridge Capital Partners is an employee-owned firm. We generate our own investment ideas using fundamental analysis and bottom-up stock picking. The investment team applies a consistent, patient and disciplined process that results in low turnover and stability. Our proven philosophy has performed well over many investment cycles and it is the consistent application of this strategy that makes Pacific Ridge unique.
The principals of Pacific Ridge Capital Partners are invested along with our clients in each of our strategies.
PRCP Small Cap Value – Our Small Cap Value strategy generally purchases stocks in the bottom three-quarters of the Russell 2000® Index. This smaller capitalization segment has a large number of underfollowed companies, providing us the greatest opportunity to exploit market inefficiencies. The typical range of holdings is between 100 and 150.
PRCP Micro Cap Value – Our Micro Cap Value strategy generally purchases stocks in the Russell Microcap® Index. This segment is widely underfollowed, providing us the greatest opportunity to exploit market inefficiencies. The typical range of holdings is between 50 and 80.
We believe these market cap segments offer great potential returns and additional diversification for our clients. For further information about Pacific Ridge Capital Partners and our investment strategies, we invite you to contact Tammy Wood via email at Tammy.Wood@PacificRidgeCapital.com or by phone at (503) 878-8502.
Disclosures
Pacific Ridge Capital Partners, LLC (“Pacific Ridge”, “PRCP”, or “the Firm”) is an employee-owned investment advisor registered with the Securities and Exchange Commission under the Investment Advisor Act of 1940. The Firm was established in June 2010, and has one office located in Lake Oswego, Oregon. Pacific Ridge claims compliance with the Global Investment Performance Standards (GIPS®).
Sources: Pacific Ridge; FactSet Research Systems (“FactSet”); and Russell Investment Group (“Russell”) who is the source and owner of the Russell Index data.
The current annual investment advisory fees for the portfolios managed in the Firm’s Small and Micro Cap Value strategies are 1.00% and 1.50% of assets, respectively. Returns for the composites are presented gross and net of management fees and other expenses and includes realized and unrealized gains and losses, cash and cash equivalents and related interest income, and accrued based dividends. The Firm calculates time weighted rates of return by geometrically linking portfolio simple rates of return at least monthly, with adjustments made for significant external cash flows. The composite returns are calculated by asset weighting the individual portfolio returns using beginning of the period values. All returns are calculated after the deduction of the actual trading expenses incurred during the period.
The information provided should not be considered a recommendation to purchase or sell any particular security. There is no assurance that any securities discussed herein will remain in our strategy at the time you receive this report or that securities sold have not been repurchased. It should not be assumed that any of the holdings discussed herein were or will be profitable or that the investment recommendations or decisions we make in the future will be profitable or will equal the investment performance of the securities discussed herein. Past performance is no guarantee of future results.
Although the statements of fact and data in this report have been obtained from, and are based upon, sources that the Firm believes to be reliable, we do not guarantee their accuracy, and any such information may be incomplete or condensed. All opinions included in this report constitute the Firm’s judgment as of the date of this report and are subject to change without notice. This report is for informational purposes only and is not intended as an offer or solicitation with respect to the purchase or sale of any security.
The Russell 2000® Value Index measures the performance of the Russell 2000 companies with lower price-to-book ratios and lower forecasted growth values. For comparison purposes, the index is fully invested, which includes the reinvestment of income. The return for the index does not include any transaction costs, management fees or other costs.
The Russell Microcap® Value Index measures the performance of the microcap segment of the U.S. equity market. For comparison purposes, the index is fully invested, which includes the reinvestment of income. The return for the index does not include any transaction costs, management fees or other costs.
Returns and asset values are stated in US dollars.