

Small Cap Value Performance Review - Fourth Quarter 2021
The Pacific Ridge Capital Partners Small Cap Value strategy returned 7.6%* during the fourth quarter ended December 31, 2021, outperforming the Russell 2000® Value Index (“Index”) return of 4.4%..

*Preliminary results. For additional performance information, see the related GIPS® Report on the last page.
Commentary - Digitization of the Banking Industry
Astute investing requires the ability to assess the impact of change across a multitude of industries. Consider the role of technology and the way it has reshaped how companies do business—especially the past several decades, where the pace of technological change has been dramatic. While some industries have been radically transformed, others have been slower to evolve. Take banking, for example. For generations, the industry was dominated by well-connected institutions whose size and experience created significant barriers to entry for new players. Even with the advent of the internet, traditional banks (for a time) retained key advantages over technology startups, with access to payment networks and expertise in compliance and regulations, physical infrastructure and underwriting expertise. However, in the past few years, a powerful wave of new entrants and investor capital into the Fintech space has led to new product offerings and increased convenience for consumers. Traditional barriers have steadily eroded to the point where digital banking is now widely accepted by the public.
To illustrate this, a recent article in Bank Director magazine highlighted how JPMorgan Chase resisted international expansion. The company’s Chairman and CEO, Jamie Dimon, felt that the overhead cost of establishing branches and back offices in new offshore markets was cost-prohibitive. “What we always said is we’re not going to do retail overseas. I can open 100 branches in Mumbai or 100 branches in the U.K., and there’s no chance I’d gain enough share to make up for the additional overhead.” Then Dimon said something profound: “Digital banking changes that.” Dimon’s quote highlights a critical point: Digital banking isn’t just about helping traditional banks to explore new markets. It is forcing management teams like his to invest their company’s technological capabilities in product offerings so they can stop losing market share to pure digital banks.
Pure digital banks often target customers that have historically been neglected by traditional banks. These consumers are attracted to innovative features such as a high-quality mobile interface, early access to paychecks through direct deposit and waivers on overdraft fees. Several digital banks have grown their consumer base through narrowly targeted marketing. Bank Director found that two-thirds of digital banks started in 2020 had a specific consumer niche. There are now digital banks targeted towards “creatives”, gig workers, ethnic minorities, environmentalists and doctors. This specialization is reminiscent of credit unions that historically targeted a specific niche. While this type of specialization may make it easier to draw the attention of potential account holders, customer acquisition costs in the online space still remain extraordinarily high.
While many of these pure digital banks have grown significantly over the years, most are struggling to achieve profitability. This, however, hasn’t been a hurdle to raising additional funding. Venture capital has been more than happy to step in as these digital banks attempt to scale their businesses. Chime is one example, raising over $1.5 billion in venture funding.
At Pacific Ridge, we hold a diversified portfolio of banking stocks, including pure digital, traditional banks and community banks. We closely monitor industry trends, including the impact of technology, and align our investing strategy accordingly. Some former holdings like Axos Financial (“AX”) have been at the forefront of the online banking revolution. Several of our current bank holdings are either pure or partial digital institutions, or they facilitate others in their efforts to develop online and mobile offerings.
We continue to invest in small cap community banks that are flush with deposits. As we track the trends with digital banks, we are not seeing significant industry disruption in community banks—yet. Most digital banks offer deposit accounts and credit cards, shying away from commercial loan products that are the bread and butter of community banks. We predict that large-cap retail-oriented banks and credit unions are more likely to lose customers to digital banks as the industry evolves its technological infrastructure. That said, we’ve seen this play out in other industries. Community banks must be ready to quickly and aggressively adapt their business models if they are going to successfully fend off threats from their pure digital competitors.
The strategy’s portfolio characteristics can be significantly different from the Index because we generally invest in smaller-sized and lower-valued stocks, as well as being sector indifferent. This difference is depicted in the charts below.
Size Analysis
The strategy faced a moderate size bias headwind during the quarter, as smaller companies in the Index underperformed larger companies. Those with a market capitalization below $1,052 million in the Index posted 1.3% return, versus 5.0% return for stocks with a market capitalization above the breakpoint level. The Index had 82.5% of its weight above its median market capitalization level and 17.4% below that level.
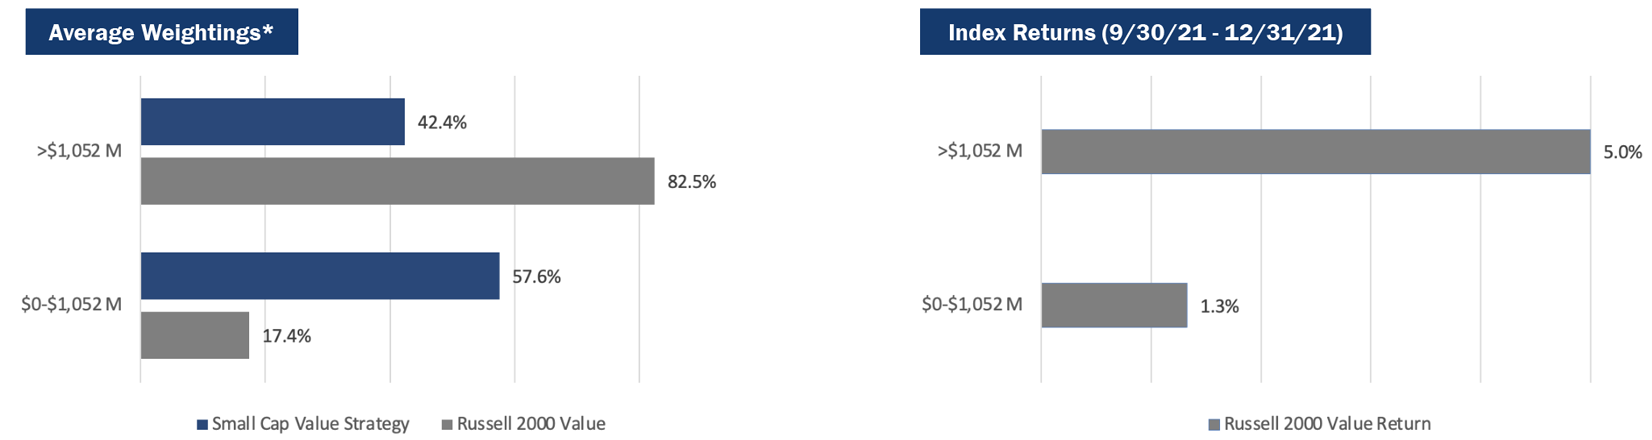
*The size breakpoint in the chart is based on the Index’s median market capitalization.
Style Analysis
The strategy benefitted from a slight value bias tailwind for profitable companies during the quarter, as stocks with lower PEs outperformed those with higher PEs. Those with a PE ratio greater than 15x had a 6.7% return versus a 7.5% return for those companies with a PE below 15x. The performance of unprofitable companies in the Index created a more notable tailwind, as those stocks posted a -9.3% return.

*PE ratios are based on analyst estimates for the current fiscal year, including both completed and estimated quarterly results. Companies that have no earnings estimates have been excluded, and thus the bars may not add up to 100%.
Sector Analysis
The strategy’s performance in Financials, Health Care, Communication Services and Information Technology contributed approximately 400 basis points of excess return relative to the Index. However, performance in Industrials and Real Estate detracted approximately 110 basis points versus the Index.

Portfolio Characteristics (as of 12/31/21)

Top Contributors**
Top Detractors**


| Photronics, Inc. | 2.1 | 0.8 |
Top Contributors**
Photronics (“PLAB”) is a maker of masks used in the production of semiconductors and flat panel displays. The company reported solid earnings during the quarter and saw its stock spike higher. Increased average selling prices in a key segment of its business led to a boost in revenue that fell significantly to the bottom line. Surging demand for these chips in an industry that continues to be capacity constrained suggests a bright outlook.
Franchise Group (“FRG”) is an operator of franchised businesses and retailers. FRG’s stake in Vitamin Shoppe outlets has been a key contributor to profitability over the past year. The vitamin chain has seen impressive revenue growth and now accounts for nearly half of FRG’s EBITDA. The company recently closed on the sale of its Liberty Tax segment and utilized the proceeds for debt reduction.
Customers Bancorp (“CUBI”), a Pennsylvania-based community bank, reported another strong quarter in earnings. The company has been a significant beneficiary of the Paycheck Protection Program (PPP). The company funded close to $10 billion in PPP loans that have exceeded $300 million in pretax profits. Non-interest bearing deposits jumped thanks to partnership deals and CUBI has expanded its lending footprint to the Carolinas.
Shyft Group (“SHYF”), a manufacturer of commercial vehicles, reported another quarter of impressive earnings and raised its full year guidance. Over the past several years, the company has been a beneficiary of increased demand for commercial delivery vehicles. Backlog continues to grow and is now at record levels, providing management good visibility into 2022.
NV5 Global (“NVEE”) is a professional and technical consulting firm. The stock moved sharply higher following earnings that beat expectations (higher revenues and margins than originally forecasted). The backlog continues to grow, leading management to raise full year guidance. Steady cash generation could be used for additional acquisitions as the balance sheet has improved following an equity offering earlier in the yea
Top Detractors**
Rimini Street (“RMNI”) is a provider of support and services for enterprise software. After the stock performed well for much of the year, it sold off sharply following the company’s earnings announcement (guidance was below expectations). The company reorganized the sales team to correct issues with sales execution and annual support contracts. With management devoting more attention to sales performance, there should be a recovery in RMNI’s backlog as they move through the year.
Healthcare Services Group (“HCSG”) provides housekeeping, laundry and dietary services to long-term care and related health care facilities. The stock has been weak over the past few quarters due to rising labor and material costs. Shares have also been penalized over a concern that the company may not fully recover outstanding receivables from its largest customer, which is in danger of filing for bankruptcy. HCSG has a favorable outlook once it move past its near-term headwinds and returns to pre-Covid level of profitability.
Frontline Ltd. (“FRO”), an acquirer of patent technologies, has seen its business evolve with its more recent investments. Several years ago, the company purchased $282 million of securities from a Life Science portfolio, which turned out to be a home run. While some of the assets have been sold for substantial gains, many that remain are priced well below market value. The company continues to be aggressive with profitable acquisitions as they look to utitlize net operating losses on their books.
Acacia Research (“ACTG”), an acquirer of patent technologies, has seen its business evolve with its more recent investments. Several years ago, the company purchased $282 million of securities from a Life Science portfolio, which turned out to be a home run. While some of the assets have been sold for substantial gains, many that remain are priced well below market value. The company continues to be aggressive with profitable acquisitions as they look to utitlize net operating losses on their books.
Universal Electronics (“UEIC”) is a provider of remote controls and other home entertainment technologies. The company slightly missed earnings estimates and management issued guidance that was softer than expected, resulting in a stock sell off in the quarter. A congested supply chain and inflationary environment is driving the weak guidance and adding pressure to sales and profitability. Fortunately, these headwinds are temporary, the balance sheet remains clean and the company continues to have healthy cash flow.
**Past performance does not guarantee future results. The holdings identified do not represent all the securities purchased, sold or recommended to clients. Top contributors and detractors to return represent those securities that had the largest positive and negative total contribution to the overall portfolio return for the quarter. A complete list of contributors to portfolio return can be obtained by contacting Peter Trumbo, Chief Compliance Officer, at 503-886-8972 or by email at Peter.Trumbo@PacificRidgeCapital.com. For additional information, see the related GIPS® Report on the last page.
Market Outlook
We continue to look for modest growth in the US economy, although limited by continued supply chain disruptions and the resurgence of Covid cases. GDP growth slowed to 2.3% in the third quarter of 2021, driven by lower personal consumption as spending for goods turned down versus the second quarter. We expect mid-single-digit GDP growth in the fourth quarter of 2021 and slightly lower growth for 2022, given supply shortages and price concerns. Sentiment amongst purchasing managers remains positive, with the December 2021 US manufacturing PMI reading of 58.7—the nineteenth consecutive month of expansion. New orders and production components remain strong while inventories appear to be building slightly. However, transportation bottlenecks have significantly stalled the pace of deliveries, setting up a potential restocking event this year as the flow of goods improves.
As always, we continue to search for companies that demonstrate an ability to earn a fair return on capital. We welcome any questions or comments you may have and thank you for your continued support.
Sincerely,
Pacific Ridge Capital Partners
Investment Team Additional Professionals
Mark Cooper, CFA® Co-Senior Portfolio Manager Peter Trumbo Chief Operating/Compliance Officer
Dominic Marshall, CFA® Co-Senior Portfolio Manager Mike McDougall Senior Trader
Ryan Curdy, CFA® Portfolio Manager Manisha Thakkar, CFA® Director of Business Development
Justin McKillip, CFA® Senior Analyst Veronica Orazio Operations Assistant
Adam Boyce, CFA® Senior Analyst
Regulatory Disclosures
The contributors and detractors to return, market capitalization weightings and total effect, economic sector weightings and total effect, portfolio characteristics, and top ten holdings for the Small Cap Value Composite are based on a representative account within the strategy. The representative account statistics are shown as supplemental information and complement the composite’s GIPS® Report as provided on the last page.
The Russell 2000® Value Index measures the performance of the small cap segment of the U.S. equity market. For comparison purposes, the index is fully invested, which includes the reinvestment of income. The return for the index does not include any transaction costs, management fees or other costs.
In order to maintain consistency when comparing the Small Cap Value strategy to the Russell benchmark, the Firm utilizes FactSet’s outlier methodology calculations which provide a comparable portfolio characteristic calculation methodology as Russell applies to its indices.
The information provided should not be considered a recommendation to purchase or sell any particular security. There is no assurance that any securities discussed herein will remain in our strategy at the time you receive this report or that securities sold have not been repurchased. It should not be assumed that any of the holdings discussed herein were or will be profitable or that the investment recommendations or decisions we make in the future will be profitable or will equal the investment performance of the securities discussed herein. Past performance is no guarantee of future results.
Although the statements of fact and data in this report have been obtained from, and are based upon, sources that the Firm believes to be reliable, we do not guarantee their accuracy, and any such information may be incomplete or condensed. All opinions included in this report constitute the Firm’s judgment as of the date of this report and are subject to change without notice. This report is for informational purposes only and is not intended as an offer or solicitation with respect to the purchase or sale of any security.
PRCP GIPS Report

*Information is not statistically meaningful due to an insufficient number of portfolios in the composite for the entire year.
**Information is not statistically meaningful due to an insufficient period of time (36 months).
Disclosures
Pacific Ridge Capital Partners, LLC (“Pacific Ridge”, “PRCP”, or “the Firm”) is a 100% employee-owned investment advisor registered with the Securities and Exchange Commission under the Investment Advisors Act of 1940. The Firm was established in June 2010, and has one office located in Lake Oswego, Oregon. Pacific Ridge claims compliance with the Global Investment Performance Standards (GIPS®) and has prepared and presented this report in compliance with the GIPS standards. Pacific Ridge has been independently verified for the periods June 10, 2010 through September 30, 2021. A firm that claims compliance with the GIPS standards must establish policies and procedures for complying with all the applicable requirements of the GIPS standards. Verification provides assurance on whether the firm’s policies and procedures related to composite and pooled fund maintenance, as well as the calculation, presentation, and distribution of performance, have been designed in compliance with the GIPS standards and have been implemented on a firm-wide basis. The Small Cap Value Composite has had a performance examination for the periods June 10, 2010 through September 30, 2021. The verification and performance examination reports are available upon request.
The Small Cap Value composite was created and incepted on August 1, 2010. The Small Cap Value composite comprises fully discretionary portfolios managed by the Firm invested primarily in an equity portfolio of small companies with market capitalizations similar to those found in the bottom three-quarters of the Russell 2000® Index. The strategy ascribes to a disciplined bottom-up fundamental selection process with an emphasis given to the cash flow generating capabilities of a company. The strategy’s objective is to outperform the Russell 2000® Value Index which is used as our benchmark. Eligible portfolios must be managed for a full calendar month prior to inclusion in the Small Cap Value composite. Composite dispersion is measured using an asset weighted standard deviation of gross returns of the portfolios included for the entire year. Returns and asset values are stated in US dollars.
The Russell 2000® Value Index measures the performance of the Russell 2000 companies with lower price-to-book ratios and lower forecasted growth values. For comparison purposes, the index is fully invested, which includes the reinvestment of income. The return for the index does not include any transaction costs, management fees or other costs.
Sources: Pacific Ridge; FactSet Research Systems (“FactSet”) and Russell Investment Group (“Russell”), who is the source and owner of the Russell Index data.
Returns for the Small Cap Value composite are presented gross and net of management fees and other expenses and includes real ized and unrealized gains and losses, cash and cash equivalents and related interest income, and accrued based dividends. Net returns are calculated by deducting the highest annual management fee of 1.00% from the quarterly gross composite return. Performance-based fees are available upon request. All returns are calculated after the deduction of the actual trading expenses incurred during the period. The management fee schedule and total expense ratio for the Small Cap Value Fund, which is included in the composite, are 1.00% on all assets and 1.23%, respectively, as of the most recent audit. Total fees for the fund may not exceed 1.25% annually.
The fee schedule for separately managed accounts is a flat rate of 1.00%.
The portfolio characteristics, sector weightings and attribution analysis for the Small Cap Value composite are based on a representative account within the strategy. The representative account statistics are shown as supplemental information. The Firm maintains a complete list and description of composites and pooled funds, policies for valuing portfolios, calculating performance, and preparing GIPS Reports which are available upon request by contacting Peter Trumbo, Chief Compliance Officer at (503) 886-8972 or Peter.Trumbo@PacificRidgeCapital.com.
GIPS® is a registered trademark of CFA Institute. CFA Institute does not endorse or promote this organization, nor does it warrant the accuracy or quality of the content contained herein.
Top 5 and Bottom 5 Performing Securities represent those security holdings that had the largest positive and negative total contribution to the portfolio return. Top 3 and Bottom 3 Economic Sectors represent those sectors that had the largest positive and negative total contribution to the portfolio return.
In order to maintain consistency when comparing the Small Cap Value strategy to the Russell benchmark, the Firm utilizes FactSet’s outlier methodology calculations which provide a comparable portfolio characteristic calculation methodology as Russell applies to its indices.
The information provided should not be considered a recommendation to purchase or sell any particular security. There is no assurance that any securities discussed herein will remain in our strategy at the time you receive this report or that securities sold have not been repurchased. It should not be assumed that any of the holdings discussed herein were or will be profitable or that the investment recommendations or decisions we make in the future will be profitable or will equal the investment performance of the securities discussed herein. Past performance is no guarantee of future results.
Although the statements of fact and data in this report have been obtained from, and are based upon, sources that the Firm believes to be reliable, we do not guarantee their accuracy, and any such information may be incomplete or condensed. All opinions included in this report constitute the Firm’s judgment as of the da te of this report and are subject to change without notice. This report is for informational purposes only and is not intended as an offer or solicitation with respect to the purchase or sale of any security.