

Performance Review
The Pacific Ridge Capital Partners Micro Cap Value strategy (the “Strategy”) returned 15.3%* (14.9%* net of fees) during the fourth quarter ended December 31, 2023, underperforming the Russell Microcap® Value Index (the “Index”) return of 16.3%. For the twelve months ended December 31, 2023, the Strategy returned 16.3%* (14.6%* net of fees) versus the Index return of 8.9%.

*For additional performance information, see the related GIPS® Report below.
The Strategy’s portfolio characteristics can be significantly different from the Index because we primarily invest in smaller, undervalued stocks and adopt a sector-agnostic approach. You can see these distinctions in the charts below.
Size Analysis
During the quarter, the Strategy received a moderate size tailwind, where smaller companies in the Index outperformed larger ones. Stocks with a market capitalization below the $229 million Index median saw a return of 19.5%, versus 15.7% return for stocks with a market capitalization above the breakpoint level. The Index had 16.8% of its weight below the median market capitalization level, while the Strategy had a comparatively higher 48.2% weight.

**The size breakpoint in the chart is based on the Index’s median market capitalization at the beginning of the period.
Style Analysis
The Strategy faced a moderate style bias headwind with unprofitable companies during the quarter. Stocks with a PE ratio less than 0x posted the best return in the Index of 19.5%, where the Index had a 31.3% weight versus the Strategy’s 16.1% weight. This was compounded by subpar stock selection scores in unprofitable companies and profitable stocks with a PE ratio above 15x, contributing to the overall headwind. However, the headwind was partially offset by strong stock selection in profitable companies with relatively low valuations (PE ratio below 15x), where the Strategy has its highest weight of 57.6%.

*P/E ratios are based on analyst estimates for the current fiscal year, including both completed and estimated quarterly results. Companies that have no earnings estimates have been excluded, and thus the bars may not add up to 100%.
Sector Analysis
The top two contributing sectors to the Strategy’s performance were Consumer Discretionary and Financials. While the decision to overweight the Consumer Discretionary sector caused a modest headwind, this was surpassed by the beneficial impact of positive stock selection scores. Conversely, moderately overweighting the Financials sector generated a small tailwind, further boosted by favorable stock selection scores. The two sectors that most negatively impacted the Strategy’s performance were Information Technology and Health Care. Although there was a positive allocation effect from overweighting Technology, poor stock selection scores were a major detractor. Additionally, the absence of exposure to Health Care also contributed to the negative impact on the Strategy’s overall performance.

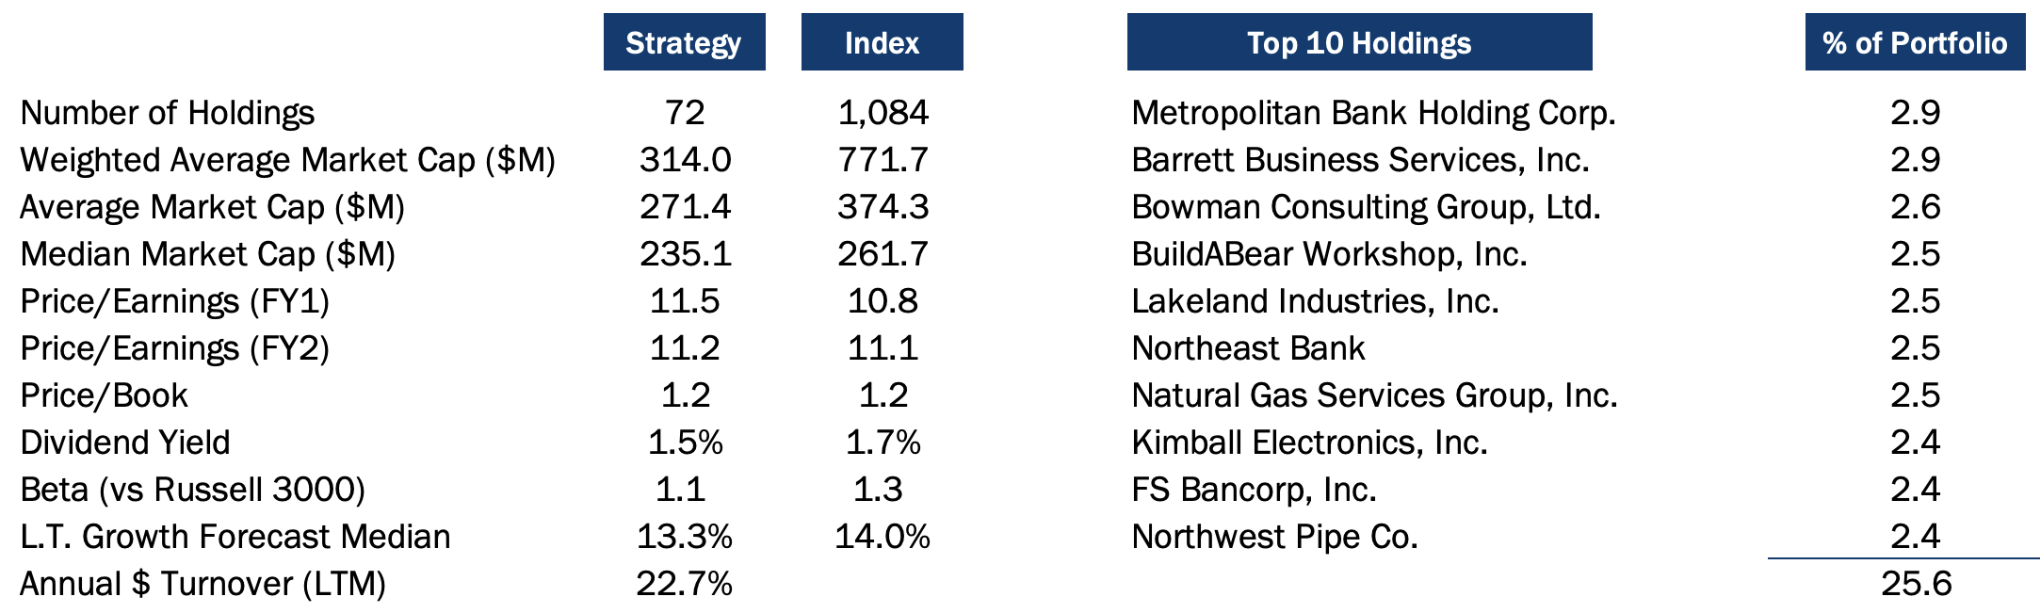
Portfolio Characteristics (as of 12/31/23)
Top Contributors
Top Detractors


Top Contributors
Metropolitan Bank Holding (“MCB”) is a community bank based in Manhattan, NY. MCB came under significant pressure earlier this year during the March banking crisis due to claims that the bank had similar risk factors as other recent bank failures. Following a third straight quarter of clean operating results without any notable deterioration in the fundamentals, the stock rallied significantly higher to close out the year. We trimmed some weight late in the quarter once it became the largest position in the portfolio.
Manitex International (“MNTX”), a provider of highly specialized lifting and hauling solutions to niche end markets, reported another strong quarter of organic revenue growth, margin expansion, and earnings that exceeded expectations. The demand for lifting products is primarily driven by the robust growth in infrastructure, energy, and construction end markets. Management anticipates that the current low dealer inventory will likely pave the way for favorable restocking trends in the coming quarters. We expect working capital to normalize in the near term, providing a tailwind for free cash flow.
Barrett Business Services (“BBSI”), a provider of human resource outsourcing, reported strong third quarter results that helped drive the shares 29% higher. Some investors in this environment incorrectly view BBSI as a temporary staffing company (a small piece of their business), causing them to miss opportunities for BBSI’s growth and margin expansion. Those stem from an asset-light geographic expansion model, a new health care insurance offering that has facilitated engagements with a broader range of white-collar clients, and a significantly reduced risk profile within its workers’ compensation exposure structure.
Red Robin Gourmet Burgers (“RRGB”) is a family-friendly hamburger restaurant chain with just over 500 locations. The shares have gyrated since our initial investment just over a year ago, driven by factors such as food commodity prices and concerns over weakening consumer demand. The most recent quarter showed better-than-expected results, and new management has effectively reduced the company’s financial risk via a series of sale-leaseback transactions. Despite being up 55%, the stock looks attractive at just over 0.2x enterprise value to sales, with the potential for returning 5%+ operating margins in the near term.
Universal Technical Institute (“UTI”) is a technical training school specializing in automotive repair, skilled trades, and nursing. The stock performed very well throughout 2023 as management integrated a substantial acquisition, adding campuses and new programs. Robust enrollment growth has provided an additional tailwind, prompting management to issue strong guidance for next year. Towards the end of the year, the company witnessed its convertible preferred shares convert to common shares, a move that is expected to bolster future liquidity.
Top Detractors
Amtech Systems (“ASYS”), a manufacturer of semiconductor capital equipment, reported disappointing earnings again this quarter, impacted by ongoing weakness in the industry. The stock took a significant hit, plummeting 45% this quarter. This downturn was primarily caused by a delay in a 10-K filing, as efforts were focused on assessing and calculating essential impairment charges. The stock was also impacted by higher interest costs from a bank debt restructuring. ASYS is still well positioned to benefit from the proliferation of semiconductor content, especially electric vehicles, but market perception of that space also soured this quarter.
BuildABear Workshop (“BBW”) is a specialty retailer with a strong brand affinity that offers an interactive “make your own stuffed animals” experience. After a strong rise in the previous quarter and the past few years, shares pulled back 22% in the quarter. Despite continued strong results of late, management warned that it saw signs of consumer weakness in October and November. The current valuation is appealing at less than 4x enterprise value to EBITDA, a PE of less than 7x, and a strong balance sheet. After trimming the position last quarter, we added back in this quarter.
Profire Energy (“PFIE”), a provider of combustion management systems primarily for the oil and gas industry, reported favorable results in its latest quarter, driven by strength in its core business and good traction toward diversification efforts in other end markets. However, after strong stock price performance in the prior quarter, the shares sold off due to poor energy sentiment from lower commodity prices. Further progress in developing non-energy markets will be key to offset the historically volatile legacy business.
DMC Global (“BOOM”) a diversified manufacturer of oilfield service equipment and architectural building products, continues to report improved financial results, but its latest quarter fell slightly below expectations. Weakness in the building products group and lower oil and gas well completions caused revenue to fall for the first time in over two years. The sharp oil price pullback and the negative energy sentiment also likely pressured the shares. Margins remain healthy, however, and will be aided by recent investments in automation and productivity projects. Free cash flow has been strong, enabling the company to pay down a significant amount of debt over the past several quarters.
Smith Micro Software (“SMSI”) provides location and data/content monitoring software and services for major wireless carriers. Due to consolidation in the wireless industry and SMSI acquisitions, it has taken longer than expected for a company turnaround and a ramp in revenue to occur. In the meantime, the firm has posted losses and diluted existing shareholders. SMSI now appears to be well-positioned for growth, supported by its partnerships with large domestic carriers and a recent partnership announcement with a new tier one European carrier. With its high gross margins, the company anticipates positive operating leverage as revenue grows.
Market Outlook
In 2023, market volatility surged due to rising interest rates and persistent global supply chain issues. Among the standout performers for the year were the dominant large-cap technology stocks. However, a shift occurred in the final quarter as small-cap stocks outperformed large-caps by a significant margin. This change coincided with the 10-year Treasury yield dropping to 3.9% from its peak of 5.0% in October. Notably, smaller regional banks presented a promising investment opportunity during this period, while the energy sector stood out as the sole contributor to negative returns.
The core PCE Index, excluding food and energy, exhibited a substantial decline to 3.2% in November, down from 4.9% in December 2022. This decrease was mainly attributable to supply chain improvements. Despite consistently adding over 200,000 jobs per month throughout 2023, the unemployment rate, starting at a historic low of 3.4% in January, rose slightly to 3.7% by December. Although the job market initially appeared strong, the concentrated job growth in specific industries suggested a potential slowdown in the broader labor market.
While the final third quarter GDP dipped slightly to 4.9% from its initial reading of 5.2%, forecasts for the fourth quarter indicated a significant growth slowdown, with an estimated GDP of 1.0%. Overall, the 2023 GDP is anticipated to settle at 2.5%. In December, the Institute for Supply Management’s PMI dropped to 47.9 from 49.8 in September, signaling a possible downturn in manufacturing. Conversely, the Services PMI maintained resilience, consistently reporting expansionary figures since February, reaching 51.3 in December and surpassing September’s 50.1 reading.
As we approach 2024, anticipation of increased stock market volatility looms large as investors await cues from the Federal Reserve regarding the timing of the first rate cut of the year. The Fed intends to uphold the benchmark federal funds rate between 5.25% and 5.5%, marking a 23-year high, until they observe definitive signals of a stabilizing job market and wage growth. In this uncertain climate and muted growth, companies boasting robust balance sheets and high profitability are well-positioned to thrive.
PRCP GIPS Report

*2021 Composite Dispersion excluding one account with a significant cash flow was 0.2%.
Disclosures
Pacific Ridge Capital Partners, LLC (“Pacific Ridge”, “PRCP”, or “the Firm”) is a 100% employee-owned investment advisor registered with the Securities and Exchange Commission under the Investment Advisors Act of 1940. The Firm was established in June 2010, and has one office located in Lake Oswego, Oregon. Pacific Ridge claims compliance with the Global Investment Performance Standards (GIPS®) and has prepared and presented this report in compliance with the GIPS standards. Pacific Ridge has been independently verified for the periods June 10, 2010 through September 30, 2023. A firm that claims compliance with the GIPS standards must establish policies and procedures for complying with all the applicable requirements of the GIPS standards. Verification provides assurance on whether the firm’s policies and procedures related to composite and pooled fund maintenance, as well as the calculation, presentation, and distribution of performance, have been designed in compliance with the GIPS standards and have been implemented on a firm-wide basis. The Micro Cap Value composite has had a performance examination for the periods June 10, 2010 through September 30, 2023. The verification and performance examination reports are available upon request.
The Micro Cap Value composite was created on June 10, 2010 and incepted on April 1, 2007. Performance from 2007 to 2010 is from portfolios managed at another entity. The Micro Cap Value composite comprises fully discretionary portfolios managed by the Firm invested primarily in a concentrated equity portfolio of smaller companies with market capitalizations similar to those found in the Russell Microcap® Index. Smaller capitalization equities have historically had greater volatility than large capitalization equities. The Strategy ascribes to a disciplined bottom-up fundamental selection process with an emphasis given to the cash flow generating capabilities of a company. The Strategy’s objective is to outperform the Russell Microcap Value Index which is used as our benchmark. Eligible portfolios must be managed for a full calendar month prior to inclusion in the Micro Cap Value composite. Composite dispersion is measured using an asset weighted standard deviation of gross returns of the portfolios included for the entire year. Returns and asset values are stated in US dollars.
The Russell Microcap Value Index measures the performance of the microcap segment of the U.S. equity market. For comparison purposes, the Index is fully invested, which includes the reinvestment of income. The return for the Index does not include any transaction costs, management fees or other costs. It is not possible to invest directly in the Index.
Sources: Pacific Ridge; FactSet Research Systems (“FactSet”); and Russell Investment Group (“Russell”) who is the source and owner of the Russell Index data.
Returns for the Micro Cap Value composite are time-weighted and presented gross and net of management fees and other expenses and includes realized and unrealized gains and losses, cash and cash equivalents and related interest income, and accrued based dividends. Net returns are calculated by deducting the highest annual management fee of 1.50% from the quarterly gross composite return. Performance-based fees are available upon request. All returns are calculated after the deduction of the actual transaction costs incurred during the period.
The fee schedule for separately managed accounts is a flat rate of 1.50%.
The portfolio characteristics, sector weightings and attribution analysis for the Micro Cap Value composite are based on a representative account within the Strategy. The representative account statistics are shown as supplemental information. The Firm maintains a complete list of contributors and detractors to portfolio return as well as a complete list and description of composites and pooled funds, policies for valuing portfolios, calculating performance, and preparing GIPS Reports, all of which are available upon request by contacting Peter Trumbo, Chief Operating Officer/Chief Compliance Officer at (503) 886-8972 or Peter.Trumbo@PacificRidgeCapital.com.
GIPS is a registered trademark of CFA Institute. CFA Institute does not endorse or promote this organization, nor does it warrant the accuracy or quality of the content contained herein.
Top and Bottom Performing Securities represent those security holdings that had the largest positive and negative total contribution to the portfolio return for the quarter. Top and Bottom Economic Sectors represent those sectors that had the largest positive and negative total contribution to the portfolio return. The holdings identified do not represent all the securities purchased, sold or recommended to clients.
In order to maintain consistency when comparing the Micro Cap Value strategy to the Russell benchmark, the Firm utilizes FactSet’s outlier methodology calculations which provide a comparable portfolio characteristic calculation methodology as Russell applies to its indices.
The information provided should not be considered a recommendation to purchase or sell any particular security. There is no assurance that any securities discussed herein will remain in our Strategy at the time you receive this report or that securities sold have not been repurchased. It should not be assumed that any of the holdings discussed herein were or will be profitable or that the investment recommendations or decisions we make in the future will be profitable or will equal the investment performance of the securities discussed herein. Past performance is no guarantee of future results.
Although the statements of fact and data in this report have been obtained from, and are based upon, sources that the Firm believes to be reliable, we do not guarantee their accuracy, and any such information may be incomplete or condensed. All opinions included in this report constitute the Firm’s judgment as of the date of this report and are subject to change without notice. This report is for informational purposes only and is not intended as an offer or solicitation with respect to the purchase or sale of any security.
| Investment Team | Other Professionals | |||
| Dominic Marshall, CFA® | Senior Portfolio Manager | Peter Trumbo | Chief Operating Officer/Chief Compliance Officer | |
| Mark Cooper, CFA® | Portfolio Manager | Mike McDougall | Senior Trader | |
| Ryan Curdy, CFA® | Portfolio Manager | Manisha Thakkar, CFA® | Director of Business Development | |
| Justin McKillip, CFA® | Senior Analyst | Veronica Orazio | Operations Assistant | |
| Adam Wilkie, CFA® | Senior Analyst | |||
| Laura Moon | Analyst | |||
CFA® is a trademark owned by the CFA Institute. |
||||