

Q4’19 Micro Cap Value Strategy
Market Commentary
Fads come and fads go. What is popular for a period of time inevitably fades away once a new trend comes into vogue. Fads are especially common with children’s toys and fashion. Take unicorns, for example. Suddenly, they’re popular. Some of our staff member’s children dressed up as unicorns for Halloween and requested unicorn-themed gifts for their birthday and for the holidays. Yet, this trend will almost certainly die out when the next fad grabs their attention, just as we experienced with Pet Rocks, Beanie Babies and Tickle-me Elmo.
The world of investing has also been prone to fads—unicorns included. Not the magical rainbow-themed kind, but a private company with venture capital backing that has achieved a valuation in excess of $1 billion. To a growth-oriented investment manager, these companies can feel like a fairy tale, complete with enchanted returns for early investors.
Since unicorns aren’t publicly traded and investment managers have latitude in how these companies are valued on their books, their valuations are less reliable. This can result in artificial gains when revenues are growing rapidly. Investors become enthralled with the company’s swift upward mobility and lose their focus on profitability and cash flow. Subsequent capital raises at higher valuations can mask the reality that much of the investment is dependent on the greater fool theory and an eventual initial public offering. Investors mystically deceive themselves into thinking that increased scale will automatically lead to operating leverage and a path to profitability. When this is delayed or revenue growth begins to taper off, changes to investor confidence and in company valuation can be swift and dramatic. The magic dissipates and the fairy tale becomes a nightmare.
One recent example of this is WeWork, which was valued as high as $50 billion less than a year ago. Since then, a failed IPO and management shake-up has seen the estimated value sink below $10 billion, with numerous clouds still lurking over the company. Then there’s Uber, Lyft and Blue Apron. These prominent unicorns managed to go public even though they weren’t profitable, only to see a sharp reversal in sentiment and value. The number of unprofitable companies completing IPOs is reaching historic levels not seen since the tech bubble of the 1990s. In fact, over 70% of US-listed IPOs last year had negative earnings*. Just as sentiment shifted rapidly twenty years ago, we are beginning to see a similar dynamic play out again as access to capital becomes more challenging.
As value investors, we welcome this return to reasoned thinking. The unicorn mania of the past several years has led to a prolonged headwind for value stocks. Now, we see early indications that the long-awaited reversion may finally be underway. Just as with other investment fads in the past, be they Dutch tulips, the nifty fifty, dot coms, real estate flipping or unicorns, we calmly watch the current craze from a distance and ask ourselves a simple question: “When do we think the mania will end?” The decline of unprofitable technology stocks in 2000 led to a prolonged period of significant value outperformance. We anticipate a similar dynamic playing out again in this cycle.
Strategy Review
The Pacific Ridge Capital Partners’ Micro Cap Value strategy returned 11.9%* during the fourth quarter of 2019, outperforming the 10.5% return of the Russell Microcap® Value Index (“Index”). Over the trailing one-, three- and five-year periods, the strategy returned 29.8%*, 9.2%* and 12.6%* (annualized), respectively, compared to the Index returns of 21.3%, 5.9% and 7.7%. Since inception on April 1, 2007, the strategy has returned 11.1%* annually versus 5.4% for the Index.

Top Contributors and Detractors to Return*

Top Contributors
Ultra Clean Holdings (“UCTT”) is a developer and manufacturer of critical subsystems in the semiconductor capital equipment industry. The stock steadily recovered through the year following a consistent sell-off throughout 2018. Renewed optimism stems from a recovery in original equipment manufacturer sales, as well as solid growth in UCTT’s service business. Positive management commentary led to 2020 earnings estimates that reflect sharp growth over 2019.
COHU (“COHU”) is a manufacturer of semiconductor test and inspection handling equipment. The stock moved higher during the second half of the year on the heels of an improved outlook in the semiconductor space. The company is expecting a notable tailwind in the coming years, thanks to increased demand for radio frequency testers required by the ongoing expansion of 5G networks.
Spartan Motors (“SPAR”), a manufacturer of commercial vehicles, reported another solid quarter of earnings. The stock nearly tripled in 2019 following a sharp sell-off in late 2018. Recent strength has been driven by large orders from USPS and Amazon, combined with management’s decision to focus on plant consolidations that should boost profitability. Margins are expected to expand further in 2020 as revenue continues to grow at a steady pace.
ZAGG (“ZAGG”), a provider of mobile phone battery packs and accessories, rebounded from multi-year lows during the quarter, thanks to earnings results that were above expectations. Management is exploring strategic alternatives as demand from iPhone users softens. Reiterated guidance for the fourth quarter and the potential for an acquisition has placed an elevated floor under ZAGG’s stock price.
CAI International (“CAI”), an intermodal freight container leasing and management company, initially rallied early in the quarter as trade tensions dissipated and a tentative agreement was reached with China. The stock also spiked higher in mid-December when the company announced that they were reviewing strategic alternatives, suggesting that they may put themselves up for sale. It seems plausible that there would be willing suitors given CAI’s profitability. That said, the stock continues to trade for less than tangible book value.
Top Detractors
Freightcar America (“RAIL”), a manufacturer of rail cars, reported another earnings miss during the quarter and continued to struggle through a multi-year industry downturn. Management is implementing cost saving initiatives, restructuring its operations and is closing several facilities. While there are signs that the backlog has bottomed out, RAIL has a ways to go to return to profitability.
Lifetime Brands (“LCUT”) is a manufacturer of kitchenware and tableware products. The stock has been on a steady downtrend the past few years as LCUT continues to experience margin pressure from the changing retail landscape. More recently, management cited the strengthening dollar, macro headwinds and tariffs as factors that led to poor performance in some of their product lines.
Manitex (“MNTX”) is a provider of highly specialized lifting and hauling solutions to niche end markets. The company missed earnings estimates during the quarter due to weakness in certain sectors, particularly in the energy space. A new CEO and modest growth in the backlog provide some near-term optimism.
One Stop Systems (“OSS”) is a specialty provider of high performance computing and related storage systems. After a strong rally in the stock price last fall, it gradually gave up those gains during the fourth quarter despite meeting earnings expectations and announcing numerous design wins—a prelude to a strong 2020. With a very low market capitalization, the stock remains well under the radar of most investors.
Profire Energy (“PFIE”), a manufacturer of burner-management technologies in the oil and gas industry, continues to see revenues decline due to a depressed spending environment within the energy sector. PFIE’s end markets are highly cyclical, but the company’s strong balance sheet should help them weather the difficult conditions. Additionally, PFIE recently launched a next-generation system that should drive the top line revenue if and when the industry recovers.
*Past performance does not guarantee future results. The holdings identified do not represent all the securities purchased, sold or recommended to clients. The top contributors and detractors to return represent those securities that had the largest positive and negative total contribution to the overall portfolio return for the quarter. A complete list of contributors to portfolio return can be obtained by contacting Peter Trumbo, Chief Compliance Officer, at 503-886-8972 or by email at Peter.Trumbo@PacificRidgeCapital.com. For additional information, see the related GIPS® compliant presentation on the last page.
Market Capitalization Analysis
There was minor size-bias tailwind during the quarter, as smaller companies in the Index slightly outperformed larger companies. Those with a market cap over $400 million in the Index returned 10.0%, versus a gain of 11.0% for firms with a market cap below $400 million. The strategy had 70.5% of its holdings in companies with a market cap below $400 million, compared to 45.2% for the Index.

Style Analysis
There was a significant value-bias tailwind for profitable companies during the quarter, as stocks with lower PEs outperformed those with higher PEs. However, strong performance of unprofitable companies in the Index created a modest headwind, as those stocks returned 14.1%, versus a gain of 10.0% for firms that were profitable. The strategy had 4.6% of its holdings in unprofitable companies, compared to 17.2% for the Index.

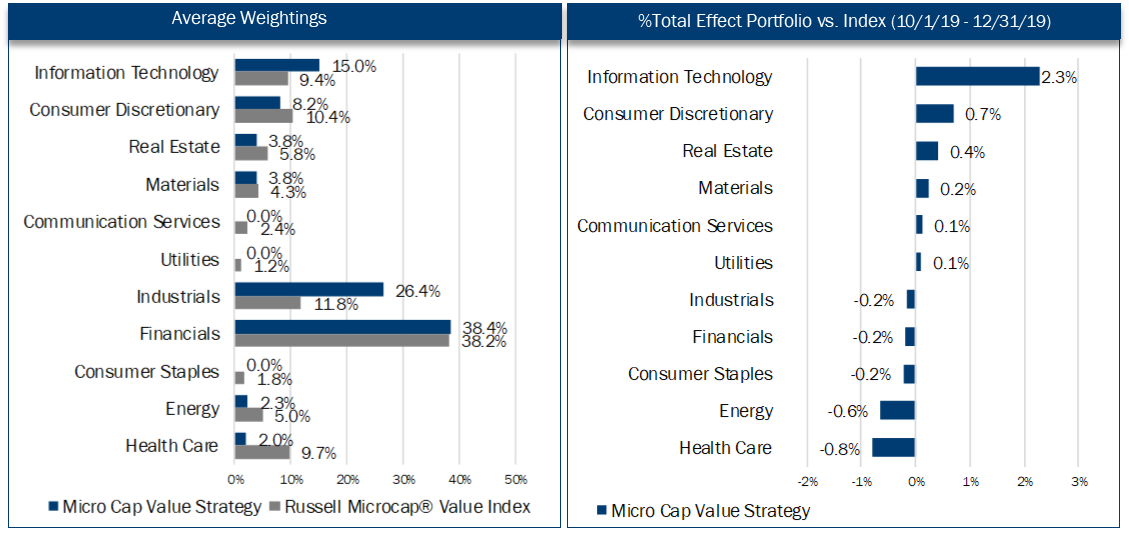
Economic Sector Analysis
The strategy’s performance in Consumer Discretionary and Information Technology contributed approximately 300 basis points of excess return versus the Index. However, performance in Energy and Health Care detracted approximately 140 basis points. The strategy’s lack of exposure to the Utilities and Communication Services sectors provided approximately 20 basis points of excess returns during the quarter, while the lack of exposure to the Consumer Staples sector provided a headwind of about 20 basis points.
Portfolio Characteristics Top Ten Holdings As of 12/31/2019

Market Outlook
We continue to have a modest growth outlook for the US economy, though pockets of softening data and trade-related uncertainty could lead to uneven activity in the near-term. Sentiment amongst purchasing managers continued to indicate a slowdown in the manufacturing sector. The December US manufacturing PMI slipped further to 47.8, the lowest since June 2009. Third quarter 2019 GDP of 2.1% was essentially flat from the prior quarter and reflected positive contributions from personal consumption, government spending, and residential investment offset by slower corporate inventory investment and non-residential spending. Consumer spending remains healthy and employment is high, but jobs data will be closely monitored given the cautious business climate. GDP growth is expected to remain moderate around the 2.0% level going into the 2020 election year. Corporate profitability and balance sheets remain strong.
As always, we continue to search for companies that demonstrate an ability to earn a fair return on capital. We welcome any questions or comments you may have and thank you for your continued support.
Sincerely,
Pacific Ridge Capital Partners
Investment Team Additional Professionals
Mark Cooper, CFA® Co-Senior Portfolio Manager Peter Trumbo Chief Operating Officer/Compliance Officer
Dominic Marshall, CFA® Co-Senior Portfolio Manager Mike McDougall Senior Trader
Ryan Curdy, CFA® Portfolio Manager Tammy Wood Director, Marketing & Business Development
Justin McKillip, CFA® Senior Analyst Veronica Orazio Operations Assistant
Adam Boyce, CFA® Senior Analyst
Regulatory Disclosures
The contributors and detractors to return, market capitalization weightings and total effect, economic sector weightings and total effect, portfolio characteristics, and top ten holdings for the Micro Cap Value Composite are based on a representative account within the strategy. The representative account statistics are shown as supplemental information and complement the composite's GIPS® disclosure presentation as provided on the last page.
The Russell Microcap® Value Index measures the performance of the microcap segment of the U.S. equity market. For comparison purposes, the index is fully invested, which includes the reinvestment of income. The return for the index does not include any transaction costs, management fees or other costs.
In order to maintain consistency when comparing the Micro Cap Value strategy to the Russell benchmark, the Firm utilizes FactSet’s outlier methodology calculations which provide a comparable portfolio characteristic calculation methodology as Russell applies to its indices.
The information provided should not be considered a recommendation to purchase or sell any particular security. There is no assurance that any securities discussed herein will remain in our strategy at the time you receive this report or that securities sold have not been repurchased. It should not be assumed that any of the holdings discussed herein were or will be profitable or that the investment recommendations or decisions we make in the future will be profitable or will equal the investment performance of the securities discussed herein. Past performance is no guarantee of future results.
Although the statements of fact and data in this report have been obtained from, and are based upon, sources that the Firm believes to be reliable, we do not guarantee their accuracy, and any such information may be incomplete or condensed. All opinions included in this report constitute the Firm’s judgment as of the date of this report and are subject to change without notice. This report is for informational purposes only and is not intended as an offer or solicitation with respect to the purchase or sale of any security.

Disclosures
Pacific Ridge Capital Partners, LLC (“Pacific Ridge”, “PRCP”, or “the Firm”) is a 100% employee owned investment advisor registered with the Securities and Exchange Commission under the Investment Advisors Act of 1940. The Firm was established in June 2010, and has one office located in Lake Oswego, Oregon. Pacific Ridge claims compliance with the Global Investment Performance Standards (GIPS®) and has prepared and presented this report in compliance with the GIPS standards. PRCP has been independently verified for the periods June 10, 2010 through September30, 2019. Verification assesses whether (1) the Firm has complied with all the composite construction requirements of the GIPS standards on a firm-wide basis and (2) the Firm’s policies and procedures are designed to calculate and present performance in compliance with the GIPS standards. The Micro Cap Value composite has been examined for the periods June 10, 2010 through September 30, 2019. The verification and performance examination reports are available upon request.
The Micro Cap Value composite was created on June 10, 2010. The Micro Cap Value composite comprises fully discretionary portfolios managed by the Firm invested primarily in a concentrated equity portfolio of smaller companies with market capitalizations similar to those found in the Russell Microcap® Index. The strategy ascribes to a disciplined bottom-up fundamental selection process with an emphasis given to the cash flow generating capabilities of a company. The strategy’s objective is to outperform the Russell Microcap® Value Index which is used as our benchmark. Eligible portfolios must be managed for a full calendar month prior to inclusion in the Micro Cap Value composite. Prior to June 10, 2010 the performance represents the track record established by the Portfolio Management Team while affiliated with prior firms. The portability of the prior track record has been reviewed by Ashland Partners & Company LLP. Composite dispersion is measured using an asset weighted standard deviation of returns of the portfolios. Returns and asset values are stated in US dollars.
The Russell Microcap® Value Index measures the performance of the microcap segment of the U.S. equity market. For comparison purposes, the index is fully invested, which includes the reinvestment of income. The return for the index does not include any transaction costs, management fees or other costs.
Sources: Pacific Ridge; FactSet Research Systems (“FactSet”); and Russell Investment Group (“Russell”) who is the source and owner of the Russell Index data.
Returns for the Micro Cap Value composite are presented gross and net of management fees and other expenses and includes realized and unrealized gains and losses, cash and cash equivalents and related interest income, and accrued based dividends. Net returns are calculated by deducting the highest annual management fee of 1.50% from the quarterly gross composite return. All returns are calculated after the deduction of the actual trading expenses incurred during the period.
The management fee is a flat rate of 1.50%.
The portfolio characteristics, sector weightings and attribution analysis for the Micro Cap Value composite are based on a representative account within the strategy. The representative account statistics are shown as supplemental information. The Firm maintains a complete list and description of composites, policies for valuing portfolios, calculating performance, and preparing compliant presentations which are available upon request by contacting Peter Trumbo, Chief Compliance Officer at (503) 886-8972 or Peter.Trumbo@PacificRidgeCapital.com.