

Q4'16 Micro Cap Value Strategy
The Pacific Ridge Capital Partners (“PRCP”) Micro Cap Value strategy rose 17.4% in the fourth quarter of 2016, ahead of the 16.3% return for the Russell Microcap® Value (“Index”). Over the trailing one-, three-, and five-year periods, the strategy returned 38.7%*, 15.3%*, and 23.5%* (annualized), respectively, compared to the Index returns of 30.6%, 8.0%, and 16.9%. Since inception on April 1, 2007, the strategy has returned 11.7%* annually versus 5.3% for the Index.
With the surprise outcomes of the Brexit vote, the US presidential election and the Cubs finally winning the World Series in 2016, we learned to expect the unexpected. Attempting to manage a strategy based in part on geopolitical outcomes would have proved difficult last year. Because a core part of our strategy is that we are not catalyst dependent (particularly in the short-term) and we tend to be contrarians by nature, we frequently question conventional wisdom and prefer to focus on valuation. This quarter, we saw clear benefits to this approach. While small-cap companies were largely out of favor early in the year, they came roaring back in the second half of the year. While higher-yielding stocks performed well the past few years, they were notable laggards over the second half of 2016. Such swings in sentiment are not uncommon and more sophisticated investors should be able to resist the urge to chase the latest fad. Despite what unexpected events may transpire in the future, we will continue to adhere to our proven value-oriented investment philosophy.
Fourth Quarter 2016
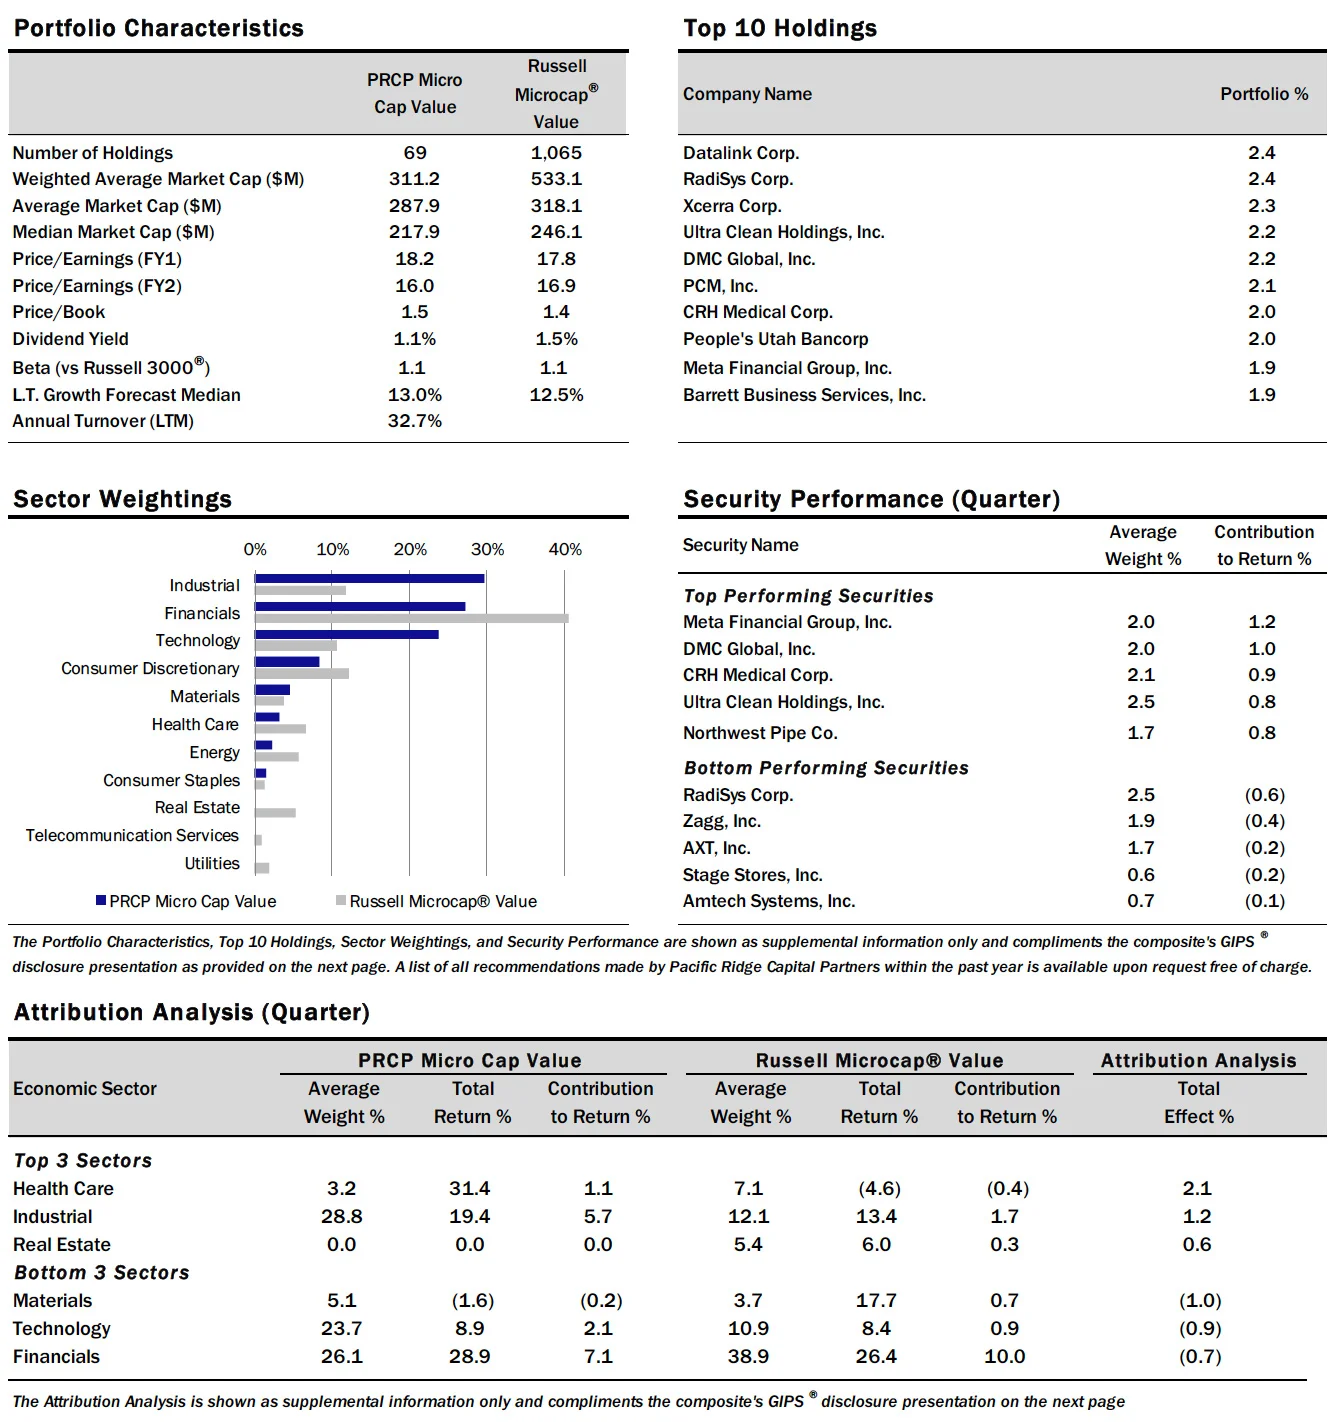
The Micro Cap Value strategy outperformed the Russell Microcap Value Index by approximately 110 basis points in the fourth quarter. Our strategy experienced a moderate headwind due to size bias this quarter. Approximately 85% of the strategy’s holdings are in companies with a market capitalization below $400 million, versus 46% for the Index. This smaller end of the Index underperformed the broader Index, 14.3% to 16.3%. The same held true for the Micro Cap Value strategy as these smaller companies slightly underperformed the broader strategy.
From a sector standpoint, the strategy’s stock selection in Industrials and Health Care contributed nearly 330 basis points of return versus the Index. However, poor stock selection in Materials detracted approximately 100 basis points versus the Index. The lack of Real Estate exposure within the strategy was a tailwind, resulting in 60 basis points of excess return during the quarter.

Industrials remained the highest weighted sector in the strategy at 28.8%. It was also the greatest overweight compared to the index at 12.1%. The strategy’s holdings in the sector returned 19.4% in the period, compared to a 13.4% gain in the Index. The greatest contributor to performance in the sector was DMC Global (“BOOM”), with the shares returning 48.9% in the quarter. BOOM, a manufacturer of oilfield service equipment, has seen their stock price recover as demand for their products has rebounded as energy prices increased. Increased market share through product innovation has also contributed to expectations for a sharp turnaround in earnings. We will maintain our position in BOOM because we feel current estimates do not fully reflect the improved environment.
Hardinge (“HDNG”), a designer and manufacturer of machine tools, was the greatest detractor to returns in the Industrials sector, with its shares down 0.3% in the quarter. The stock has been volatile over the past year as weak third quarter results led to near multi-year trading lows (although the fourth quarter results are expected to be better due to a strong backlog). The surprise election results has resulted in a surge in its stock price on expectations of increased infrastructure spending. We continue to maintain our position as we feel increased construction activity will help drive the topline in the coming years.
Financials was the second highest weighted sector in the strategy at 26.2%, and had the greatest underweight compared to the Index at 38.9%. The strategy’s holdings in this sector increased 28.9% during the period, compared to a 26.4% gain in the Index. Meta Financial (“CASH”), a unique Iowa based community bank with a substantial business servicing the gift card industry, was the greatest contributor to returns in the sector, with shares up 70.0%. Along with the rest of the banking sector, CASH has benefited from the recent rise of interest rates and the expectations for a steeper yield curve. Given the bank’s low cost of deposits through their gift card business, their earnings have tremendous leverage to higher rates. Despite the significant move in the stock over the past year, CASH continues to trade at a discount relative to peers because of upwardly revised earnings estimates.
Pacific Mercantile Bancorp (“PMBC”) was the greatest detractor to returns in the Financials sector, with its shares down 1.0% during the period. PMBC, a Southern California based community bank, has struggled to execute a successful turnaround over the past several years. Recent additions to the management team have sought to improve the credit culture and underwriting after several large loans deteriorated in quality. While this new team has charted a path to achieve a more normalized level of profitability, we fear their asset growth expectations may be too ambitious.
Information Technology was the third highest weighted sector at 23.7%, compared to 10.9% in the Index. The strategy’s holdings in this sector returned 8.9% during the period, compared to an 8.4% gain in the Index. Ultra Clean Holdings (“UCTT”) was the greatest contributor to returns in the sector, with the shares returning 30.9% in the quarter. UCTT, a developer and manufacturer of critical subsystems in the semiconductor capital equipment industry, posted strong quarterly results and implied strong guidance for 2017 based on increased demand from their two largest customers. Operating margins have rebounded from recent lows and look to be headed towards the high single-digits. UCTT remains one of our largest positions in the strategy.
RadiSys Corporation (“RSYS”) was the greatest detractor to returns in the Information Technology sector, with the shares down 17.1% in the quarter. RSYS, a developer of hardware and software for the telecommunications industry, reported disappointing earnings results, sending its shares down 10% on the announcement. Also contributing to the weakness were comments about increased expenditures going forward for sales personnel and network engineers. After speaking with management, however, we believe the increased expense is warranted given potential orders from new large customers in 2017. We added to our position following the recent weakness and feel the stock will perform well should these new customers materialize.
2016 Full Year
The Micro Cap Value strategy outperformed the Russell Microcap Value Index by approximately 810 basis points for the full year. The strategy had a clear benefit from size bias during the year, with the smaller market cap segments outperforming the larger ones. In the Index, stocks with a market cap below $400 million returned 33.1%, while those with a market cap greater than $600 million returned 23.5%. Approximately 89% of the strategy’s holdings were in these smaller companies, versus 50% for the Index.
From a sector standpoint, the strategy’s stock selection in Information Technology and Industrials contributed nearly 880 basis points of return versus the Index. However, poor stock selection in Materials detracted about 150 basis points versus the Index. The lack of Utilities and Real Estate exposure within the strategy was a headwind, detracting approximately 90 basis points versus the Index.
Industrials were the highest weighted sector in the strategy at 29.0%, and was the greatest overweight compared to the Index at 11.7%. The strategy’s holdings in the sector returned 47.4% for the year, compared to a 24.6% gain in the Index. The greatest contributor to performance in Industrials was DMC Global (“BOOM”), with the shares returning 128.6% for the year (please see the Fourth Quarter 2016 narrative for information on this security).
CAI International (“CAI”), an intermodal freight container leasing and management company, was the greatest detractor to returns in the Industrials sector, with its shares down 14.0% for the year. CAI has seen weak demand for shipping containers, as has the rest of the industry. Expectations for a rebound in fundamentals for the industry remain low, which is currently reflected in the stock’s valuation. We feel that a stabilization or turn in container economics has the potential to drive the stock well into the teens.
Financials was the second highest weighted sector in the strategy at 25.8%, and the greatest underweight compared to the Index at 39.6%. The strategy’s holdings in this sector increased 47.3% for the year, compared to a 39.4% gain in the Index. Meta Financial (“CASH”), was the greatest contributor to returns in the sector, with shares up 126.1% (please see Fourth Quarter 2016 narrative for more information on this security).
Conifer Holdings (“CNFR”) was the greatest detractor to returns in the Financials sector, with its shares down 12.1% for the year. CNFR, a Michigan based property and casualty insurer, has consistently posted disappointing results since going public in 2015. They have failed to grow their premium base to projected levels and have continued to experience adverse reserve development on their legacy businesses.
Information Technology was the third highest weighted sector at 22.7%, compared to 11.3% in the Index. The strategy’s holdings in this sector returned 40.7% during the period, compared to a 24.4% gain in the Index. RadiSys Corporation (“RSYS”), although the largest detractor to returns for the fourth quarter, was the greatest contributor to returns in the sector for the full year, with its shares returning 59.9%. As noted in the Fourth Quarter 2016 narrative, we added to our position following the recent weakness because we feel the stock will perform well should their new customers materialize.
magicJack VocalTec (“CALL”) was the greatest detractor to returns in the Information Technology sector, with its shares down 27.5% during the year. CALL, a VoIP based telecommunications company, offers a product that replaces traditional wireline telephone service at a fraction of the cost. They have attempted to increase their penetration with US consumers and small businesses, although it has been a difficult endeavor. Early in the year, they reported disappointing earnings that led to increased scrutiny over their business model. They used some of their substantial cash reserves to make an acquisition that increased their presence in the corporate market. While the company has never been in the VolP “pole position,” they have sought to carve out a small profitable niche and steadily upgrade their product line over time. The stock has rebounded somewhat since the beginning of the year, and we will continue to analyze their entry into the corporate segment.
As always, we continue to search for companies that demonstrate an ability to earn a fair return on capital. We welcome any questions or comments you may have, and thank you for your continued support.
Sincerely,
Pacific Ridge Capital Partners
*Returns are preliminary
Note: Sector weights for the strategy and index are the average for the period

Disclosures
Pacific Ridge Capital Partners, LLC (“Pacific Ridge”, “PRCP”, or “the Firm”) is a 100% employee owned investment advisor registered with the Securities and Exchange Commission under the Investment Advisors Act of 1940. The Firm was established in June 2010, and has one office located in Lake Oswego, Oregon. Pacific Ridge claims compliance with the Global Investment Performance Standards (GIPS®) and has prepared and presented this report in compliance with the GIPS standards. PRCP has been independently verified for the periods June 10, 2010 through September 30, 2016. Verification assesses whether (1) the Firm has complied with all the composite construction requirements of the GIPS standards on a firm-wide basis and (2) the Firm’s policies and procedures are designed to calculate and present performance in compliance with the GIPS standards. The Micro Cap Value composite has been examined for the periods June 10, 2010 through September 30, 2016. The verification and performance examination reports are available upon request.
The Micro Cap Value composite was created on June 10, 2010. The Micro Cap Value composite comprises fully discretionary portfolios managed by the Firm invested primarily in a concentrated equity portfolio of smaller companies with market capitalizations similar to those found in the Russell Microcap Index. The strategy ascribes to a disciplined bottom-up fundamental selection process with an emphasis given to the cash flow generating capabilities of a company. The strategy’s objective is to outperform the Russell Microcap Value Index which is used as our benchmark. Eligible portfolios must be managed for a full calendar month prior to inclusion in the Micro Cap Value composite. Prior to June 10, 2010 the performance represents the track record established by the Portfolio Management Team while affiliated with prior firms. The portability of the prior track record has been reviewed by Ashland Partners & Company LLP. Composite dispersion is measured using an asset weighted standard deviation of returns of the portfolios. Returns and asset values are stated in US dollars.
The Russell Microcap Value Index measures the performance of the microcap segment of the U.S. equity market. For comparison purposes, the index is fully invested, which includes the reinvestment of income. The return for the index does not include any transaction costs, management fees or other costs.
Sources: Pacific Ridge; FactSet Research Systems (“FactSet”); and Russell Investment Group (“Russell”) who is the source and owner of the Russell Index data.
Returns for the Micro Cap Value composite are presented gross and net of management fees and other expenses and includes realized and unrealized gains and losses, cash and cash equivalents and related interest income, and accrued based dividends. Net returns are calculated by deducting the highest annual management fee of 1.50% from the quarterly gross composite return. All returns are calculated after the deduction of the actual trading expenses incurred during the period.
The management fee is a flat rate of 1.50%.
The portfolio characteristics, sector weightings and attribution analysis for the Micro Cap Value composite are based on a representative account within the strategy. The representative account statistics are shown as supplemental information. The Firm maintains a complete list and description of composites, policies for valuing portfolios, calculating performance, and preparing compliant presentations which are available upon request by contacting Peter Trumbo, Chief Compliance Officer at (503) 886-8972 or Peter.Trumbo@PacificRidgeCapital.com.
Top 5 and Bottom 5 Performing Securities represent those security holdings that had the largest positive and negative total contribution to the portfolio return. Top 3 and Bottom 3 Economic Sectors represent those sectors that had the largest positive and negative total contribution to the portfolio return.
In order to maintain consistency when comparing the Micro Cap Value strategy to the Russell benchmark, the Firm utilizes FactSet’s outlier methodology calculations which provide a comparable portfolio characteristic calculation methodology as Russell applies to its indices.
The information provided should not be considered a recommendation to purchase or sell any particular security. There is no assurance that any securities discussed herein will remain in our strategy at the time you receive this report or that securities sold have not been repurchased. It should not be assumed that any of the holdings discussed herein were or will be profitable or that the investment recommendations or decisions we make in the future will be profitable or will equal the investment performance of the securities discussed herein. Past performance is no guarantee of future results.
Although the statements of fact and data in this report have been obtained from, and are based upon, sources that the Firm believes to be reliable, we do not guarantee their accuracy, and any such information may be incomplete or condensed. All opinions included in this report constitute the Firm’s judgment as of the date of this report and are subject to change without notice. This report is for informational purposes only and is not intended as an offer or solicitation with respect to the purchase or sale of any security.