

Performance Review
The Pacific Ridge Capital Partners Micro Cap Value strategy (the “Strategy”) returned 14.3%* (13.9* net of fees) during the third quarter ended September 30, 2024, outperforming the Russell Microcap® Value Index (the “Index”) return of 8.1%.

*Preliminary results. For additional performance information, see the related GIPS® Report below.
The Strategy’s portfolio characteristics can be significantly different from the Index because we primarily invest in smaller, undervalued stocks and adopt a sector-agnostic approach. You can see these distinctions in the charts below.
Size Analysis
During the quarter, the Strategy benefited from a modest tailwind due to its size bias, as smaller companies within the Index outperformed larger ones. Stocks with a market capitalization below the Index median of $257 million returned 8.4%, slightly ahead of the 8.0% return for companies above the median. While the Index allocated 18.6% of its weight to companies below the median, the Strategy had a significantly higher allocation at 50.8%.

**The size breakpoint in the chart is based on the Index’s median market capitalization at the beginning of the period.
Style Analysis
The Strategy benefited from a modest value style bias tailwind in unprofitable companies (stocks with PE ratio less than 0x), which returned 5.9%, the lowest return in the Index. The Index had a 28.1% weight versus the Strategy’s 14.1%. Additionally, a significant tailwind came from profitable companies with a PE ratio below 15x, which posted the best return at 10.0%. The Strategy had a 52.1% weight above the Index’s 43.3% weight. However, poor stock selection scores in profitable companies with a PE ratio above 15x (the second-best performer) somewhat offset those positive impacts.

*P/E ratios are based on analyst estimates for the current fiscal year, including both completed and estimated quarterly results. Companies that have no earnings estimates have been excluded, and thus the bars may not add up to 100%.
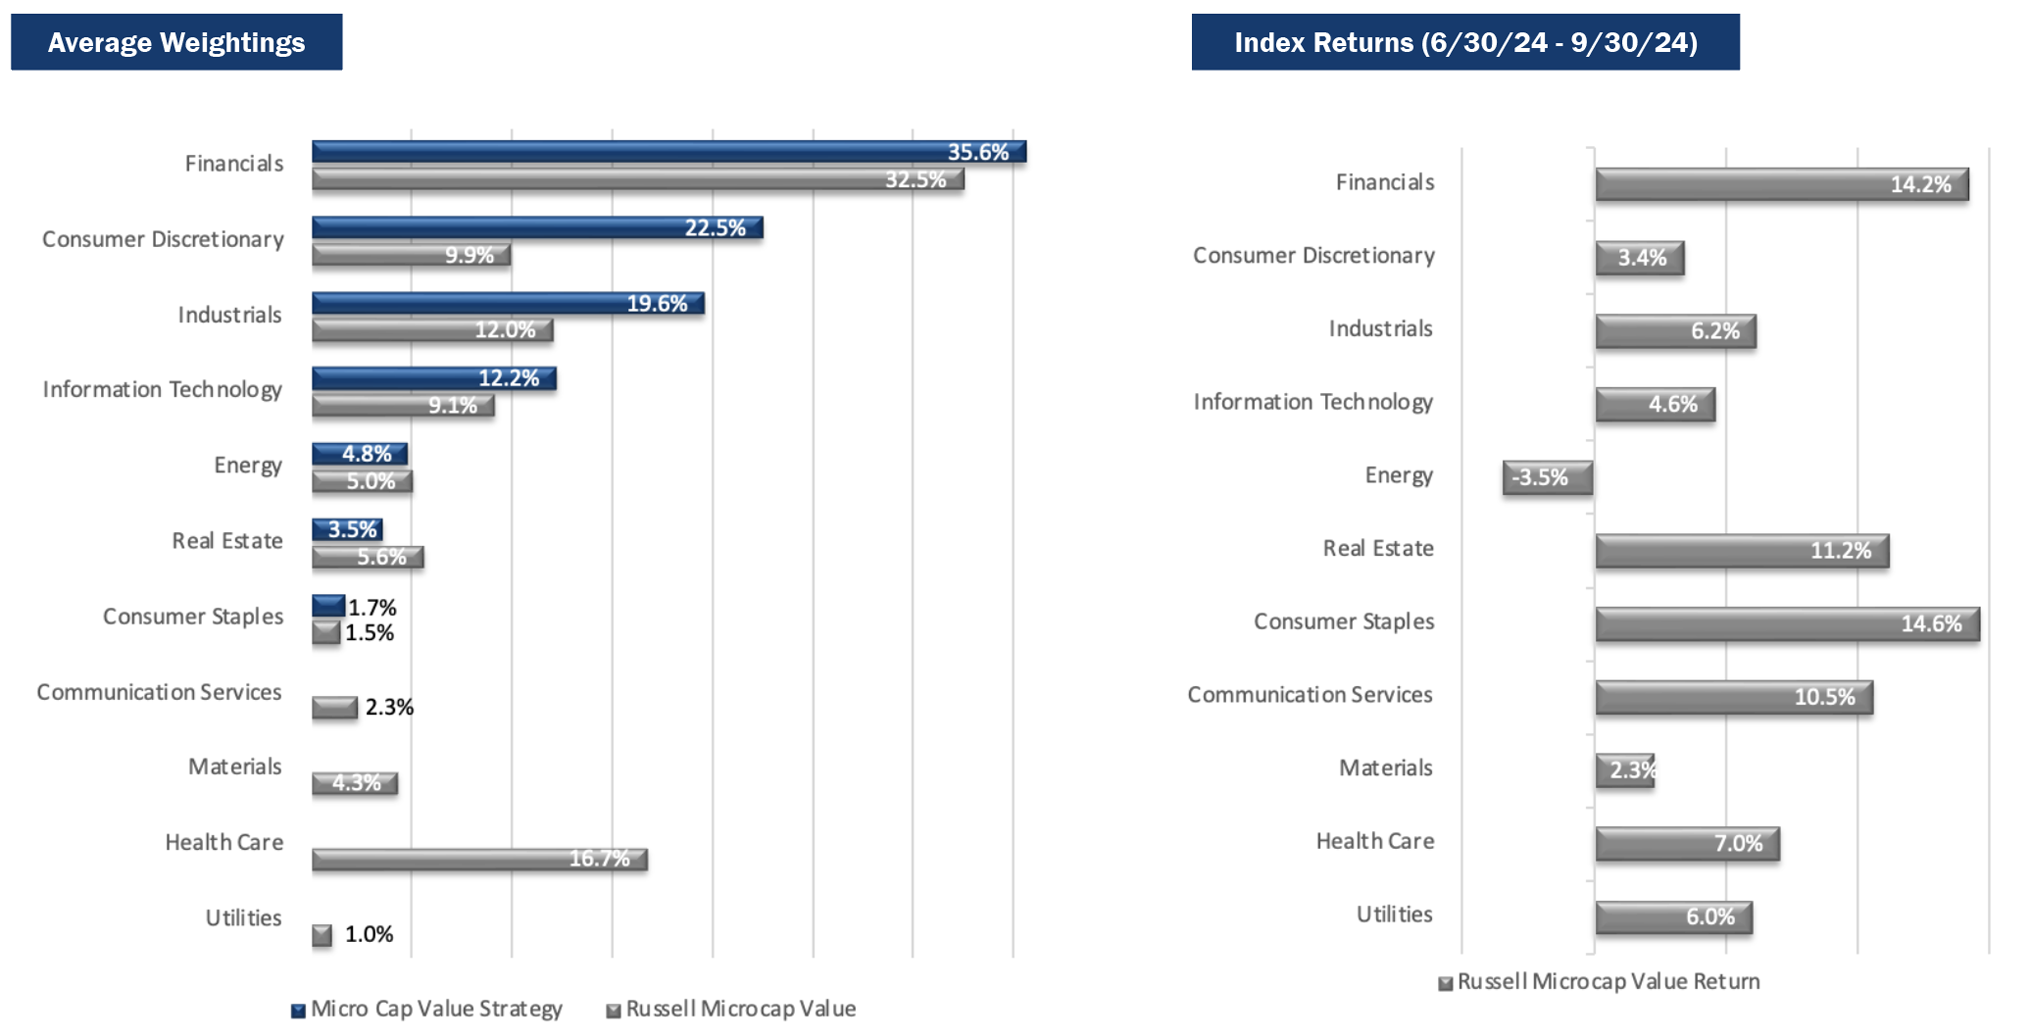
Sector Analysis
The top two contributors to the Strategy’s performance were the Financials and Consumer Discretionary sectors. The Strategy was slightly overweight in Financials compared to the Index and benefited from strong stock selection. In Consumer Discretionary, despite the Strategy being overweight in a low-returning sector, positive stock selection offset the negative effect. The two sectors that most negatively impacted the Strategy’s performance were Technology and Consumer Staples. The Strategy’s overweight in Technology hurt performance, compounded by a concentration in the poor-performing semiconductor industry group. In Consumer Staples, where the Strategy had a similar weight to the Index, performance was slightly hindered by poor stock selection scores.
Portfolio Characteristics (as of 9/30/24)

Top Contributors
Top Detractors

Top Contributors
Hamilton Beach Brands (“HBB”) is a marketer of residential and commercial kitchen appliances. The shares were purchased several years ago after management announced plans to exit retail operations and focus on wholesale and e-commerce. Since then, management navigated the choppy COVID sales cycle, delivering solid revenue growth and margin expansion, trends that we expect to continue. During the last three years, HBB has culled its product offerings and increased profit margins by nearly 300 basis points, growing earnings from $1.50 to $2.50 per share.
Heritage Insurance Holdings (“HRTG”) is a property and casualty insurer based in Tampa, Florida. The stock has seen volatile performance over the past two years. The Florida insurance market is in transition, with recent legislation curbing widespread fraud. Following a strong earnings report, HRTG shares doubled, as management indicated that earnings potential could be well above analyst estimates.
STRATTEC SECURITY (“STRT”) is a manufacturer of automotive mechanical and electronically enhanced locks and keys, latches, power lift gates and door handles. Shares outperformed this quarter as global auto production rebounded. The company also caught up with recent cost inflation. STRT is expected to see operating margins return to historical levels, which should drive the share price closer to our higher implied value.
Sleep Number (“SNBR”) designs, manufactures, and sells mattresses and bedding accessories. Its shares performed well in the quarter, driven by the company’s cost-cutting measures and an improved outlook for mattress demand. Despite the sharp rise in the share price, we continue to see significant upside.
Northwest Pipe (“NWPX”) is one of three major manufacturers of large-diameter steel pressure pipe used in water transmission (WT) infrastructure. The market is beginning to realize the long-term potential for growth in WT projects, thanks to aging infrastructure that needs replacing and from the 2021 infrastructure bill from which funds are finally flowing. NWPX recently reported strong results and has been increasingly confident in both near-term and multi-year expectations.
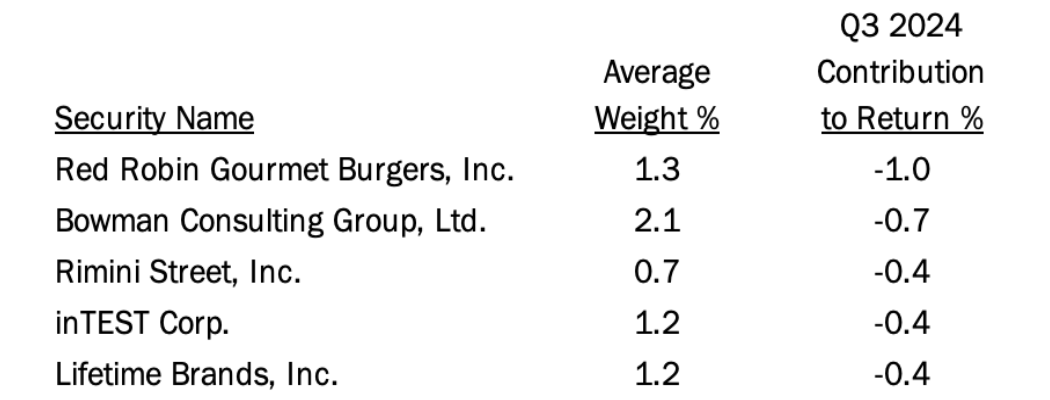
Top Detractors
Red Robin Gourmet Burgers (“RRGB”) is a family-friendly restaurant chain with over 500 locations. Since the Strategy’s initial investment two years ago, the stock has fluctuated because of factors like food commodity prices and weakening consumer demand. Shares rose in the previous quarter but recently declined after reporting weaker than expected results. However, revenues exceeded forecasts at $300M versus $295M. We believe the company is taking necessary steps, including improving guest experience, enhancing food quality, and derisking through sale-leaseback agreements.
Bowman Consulting Group (“BWMN”), a consulting firm offering engineering solutions, reported disappointing results last quarter and lowered expectations for the rest of the year. End market demand remains strong, but delayed project starts caused a revenue shortfall and higher operating costs that negatively impacted profitability. BWMN maintains a sizable and well-diversified backlog that should lead to stronger results as the timing of activity normalizes.
Rimini Street (“RMNI”) is a provider of support and services for enterprise software. RMNI has faced long-term ongoing legal challenges from Oracle, while peacefully coexisting with many of its peers. This quarter saw a big setback on the legal front, causing RMNI to throw in the towel on its PeopleSoft/Oracle practice. We are hopeful that this outcome will reduce legal expenses and allow the firm to restructure and grow profitably, albeit from a smaller base.
inTest (“INTT”) is a supplier of highly engineered process and test solutions used by a broad range of manufacturers. The company reported disappointing results last quarter and lowered expectations for the rest of the year, primarily due to persistent softness in the semiconductor market. Fortunately, past diversification efforts have enabled INTT to remain profitable during this cyclical downturn, and new cost-cutting initiatives should help protect margins in the near-term.
Lifetime Brands (“LCUT”) is a leading provider of branded tableware and kitchen tools. After stronger than expected results drove a surge in the share price in the first half of the year, the stock fell sharply in the quarter due to a slight miss on the bottom line and concern over consumer spending going into the holiday season. Management remains optimistic and maintained its full-year guidance. With a moderate amount of financial leverage, a reasonably strong performance should move the shares back higher.
Market Outlook
In early September, after two years of inversion, the yield curve finally dis-inverted. Two weeks later, the Federal Reserve lowered rates by 50 basis points, bringing the federal funds rate to 4.75%-5.00%. This larger-than-expected cut followed Fed Chair Jerome Powell’s remarks about a cooling labor market, indicating the Fed’s response to softening economic conditions. Although a dis-inversion often suggests potential for economic growth, recession risks persist. The full effects of previous rate hikes, as well as the recent cut, will likely become clearer over the next year as key economic indicators are revised and continue to evolve.
Despite mixed economic data, the stock market reached new highs in September, a month historically marked by weaker market performance. Small-cap value stocks significantly outperformed large-cap growth stocks during the third quarter, with the Russell 2000 Value Index returning 10.2%, compared to the Russell 1000 Growth Index’s return of 3.2%. This performance reflected a broader market rotation as investors sought opportunities in smaller, undervalued companies while moving away from large-cap growth stocks, which were seen as overvalued.
In August, the core PCE Index, which excludes food and energy, rose to 2.7%, slightly above July’s 2.6% and higher than the Fed’s year-end target of 2.0%. Consumer confidence dropped sharply in September, with the index falling to 98.7 from 105.6 in August, the largest monthly decline since August 2021. Concern over jobs and inflation dominated consumer sentiment. However, the September jobs report was stronger than expected, with nonfarm payrolls adding 254,000 jobs, well above the estimate of 142,500, and the unemployment rate fell to 4.1%. Employment gains were concentrated in food services, healthcare, government, social assistance, and construction.
Final Q2 2024 GDP grew by 3.0%, and the Atlanta Fed projects Q3 2024 GDP growth of 2.5%. The ISM Manufacturing Index remained unchanged at 47.2%, signaling contraction, while the ISM Services PMI rose to 54.9%, its highest level since February 2023.
The next Federal Reserve meeting on November 6-7 could bring further rate cuts if economic conditions align with expectations. As we mentioned in our first quarter 2024 Strategy Reports, there is a significant discount in the valuation of small-cap value stocks. The Russell 1000 Growth is presently trading at a price-to-earnings ratio (PE) of 31.2x for the next fiscal year, whereas the Russell 2000 Value is trading at 13.0x PE for the same period. Therefore, we believe a rotation into small-cap value stocks has further room to run.
PRCP GIPS Report

*2021 Composite Dispersion excluding one account with a significant cash flow was 0.2%.
Disclosures
Pacific Ridge Capital Partners, LLC (“Pacific Ridge”, “PRCP”, or “the Firm”) is a 100% employee-owned investment advisor registered with the Securities and Exchange Commission under the Investment Advisors Act of 1940. The Firm was established in June 2010, and has one office located in Lake Oswego, Oregon. Pacific Ridge claims compliance with the Global Investment Performance Standards (GIPS®) and has prepared and presented this report in compliance with the GIPS standards. Pacific Ridge has been independently verified for the periods June 10, 2010 through June 30, 2024. A firm that claims compliance with the GIPS standards must establish policies and procedures for complying with all the applicable requirements of the GIPS standards. Verification provides assurance on whether the firm’s policies and procedures related to composite and pooled fund maintenance, as well as the calculation, presentation, and distribution of performance, have been designed in compliance with the GIPS standards and have been implemented on a firm-wide basis. The Micro Cap Value composite has had a performance examination for the periods June 10, 2010 through June 30, 2024. The verification and performance examination reports are available upon request.
The Micro Cap Value composite was created on June 10, 2010 and incepted on April 1, 2007. Performance from 2007 to 2010 is from portfolios managed at another entity. The Micro Cap Value composite comprises fully discretionary portfolios managed by the Firm invested primarily in a concentrated equity portfolio of smaller companies with market capitalizations similar to those found in the Russell Microcap® Index. Smaller capitalization equities have historically had greater volatility than large capitalization equities. The Strategy ascribes to a disciplined bottom-up fundamental selection process with an emphasis given to the cash flow generating capabilities of a company. The Strategy’s objective is to outperform the Russell Microcap Value Index which is used as our benchmark. Eligible portfolios must be managed for a full calendar month prior to inclusion in the Micro Cap Value composite. Composite dispersion is measured using an asset weighted standard deviation of gross returns of the portfolios included for the entire year. Returns and asset values are stated in US dollars.
The Russell Microcap Value Index measures the performance of the microcap segment of the U.S. equity market. For comparison purposes, the Index is fully invested, which includes the reinvestment of income. The return for the Index does not include any transaction costs, management fees or other costs. It is not possible to invest directly in the Index.
Sources: Pacific Ridge; FactSet Research Systems (“FactSet”); and Russell Investment Group (“Russell”) who is the source and owner of the Russell Index data.
Returns for the Micro Cap Value composite are time-weighted and presented gross and net of management fees and other expenses and includes realized and unrealized gains and losses, cash and cash equivalents and related interest income, and accrued based dividends. Net returns are calculated by deducting the highest annual management fee of 1.50% from the quarterly gross composite return. Performance-based fees are available upon request. All returns are calculated after the deduction of the actual transaction costs incurred during the period.
The fee schedule for separately managed accounts is a flat rate of 1.50%.
The portfolio characteristics, sector weightings and attribution analysis for the Micro Cap Value composite are based on a representative account within the Strategy. The representative account statistics are shown as supplemental information. The Firm maintains a complete list of contributors and detractors to portfolio return as well as a complete list and description of composites and pooled funds, policies for valuing portfolios, calculating performance, and preparing GIPS Reports, all of which are available upon request by contacting Peter Trumbo, Chief Operating Officer/Chief Compliance Officer at (503) 886-8972 or Peter.Trumbo@PacificRidgeCapital.com.
GIPS is a registered trademark of CFA Institute. CFA Institute does not endorse or promote this organization, nor does it warrant the accuracy or quality of the content contained herein.
Top and Bottom Performing Securities represent those security holdings that had the largest positive and negative total contribution to the portfolio return for the quarter. Top and Bottom Economic Sectors represent those sectors that had the largest positive and negative total contribution to the portfolio return. The holdings identified do not represent all the securities purchased, sold or recommended to clients.
In order to maintain consistency when comparing the Micro Cap Value strategy to the Russell benchmark, the Firm utilizes FactSet’s outlier methodology calculations which provide a comparable portfolio characteristic calculation methodology as Russell applies to its indices.
The information provided should not be considered a recommendation to purchase or sell any particular security. There is no assurance that any securities discussed herein will remain in the Strategy at the time you receive this report or that securities sold have not been repurchased. It should not be assumed that any of the holdings discussed herein were or will be profitable or that the investment recommendations or decisions we make in the future will be profitable or will equal the investment performance of the securities discussed herein. Past performance is no guarantee of future results.
Although the statements of fact and data in this report have been obtained from, and are based upon, sources that the Firm believes to be reliable, we do not guarantee their accuracy, and any such information may be incomplete or condensed. All opinions included in this report constitute the Firm’s judgment as of the date of this report and are subject to change without notice. This report is for informational purposes only and is not intended as an offer or solicitation with respect to the purchase or sale of any security.
| Investment Team | Other Professionals | |||
| Dominic Marshall, CFA® | Senior Portfolio Manager | Peter Trumbo | Chief Operating Officer/Chief Compliance Officer | |
| Mark Cooper, CFA® | Portfolio Manager | Mike McDougall | Senior Trader | |
| Ryan Curdy, CFA® | Portfolio Manager | Manisha Thakkar, CFA® | Director of Business Development | |
| Justin McKillip, CFA® | Senior Analyst | Veronica Orazio | Operations Assistant | |
| Adam Wilkie, CFA® | Senior Analyst | |||
| Laura Moon | Analyst | |||
CFA® is a trademark owned by the CFA Institute. |
||||