

Performance Review
The Pacific Ridge Capital Partners Micro Cap Value strategy (the “Strategy”) returned 0.4%* (0.1%* net of fees) during the third quarter ended September 30, 2023, outperforming the Russell Microcap® Value Index (the “Index”) return of -5.6%.

*Preliminary results. For additional performance information, see the related GIPS® Report below.
The Strategy’s portfolio characteristics can be significantly different from the Index because we primarily invest in smaller, undervalued stocks and adopt a sector-agnostic approach. You can see these distinctions in the charts below.
Size Analysis
During the quarter, the Strategy received a small size bias tailwind where larger companies in the Index underperformed smaller ones. Stocks with a market capitalization below the $253 million Index median saw a return of -4.4%, versus a -5.9% return for stocks with a market capitalization above the breakpoint level. The Index had 81.2% of its weight above the median market capitalization level, while the Strategy had a comparatively lower 42.4% weight.

**The size breakpoint in the chart is based on the Index’s median market capitalization at the beginning of the period.
Style Analysis
The Strategy benefited from a considerable tailwind due to its pronounced value style bias, largely influenced by the sharp underperformance of unprofitable companies (PE ratio less than 0x) during the quarter. These stocks had a -16.0% return in the Index with a weight of 33.1%, compared to a -4.1% return in the Strategy with a weight of 15.8%. Additionally, the Strategy benefited by overweighting stocks with a PE ratio below 15x, which were the best-performing category for the quarter with a return of 1.6%.
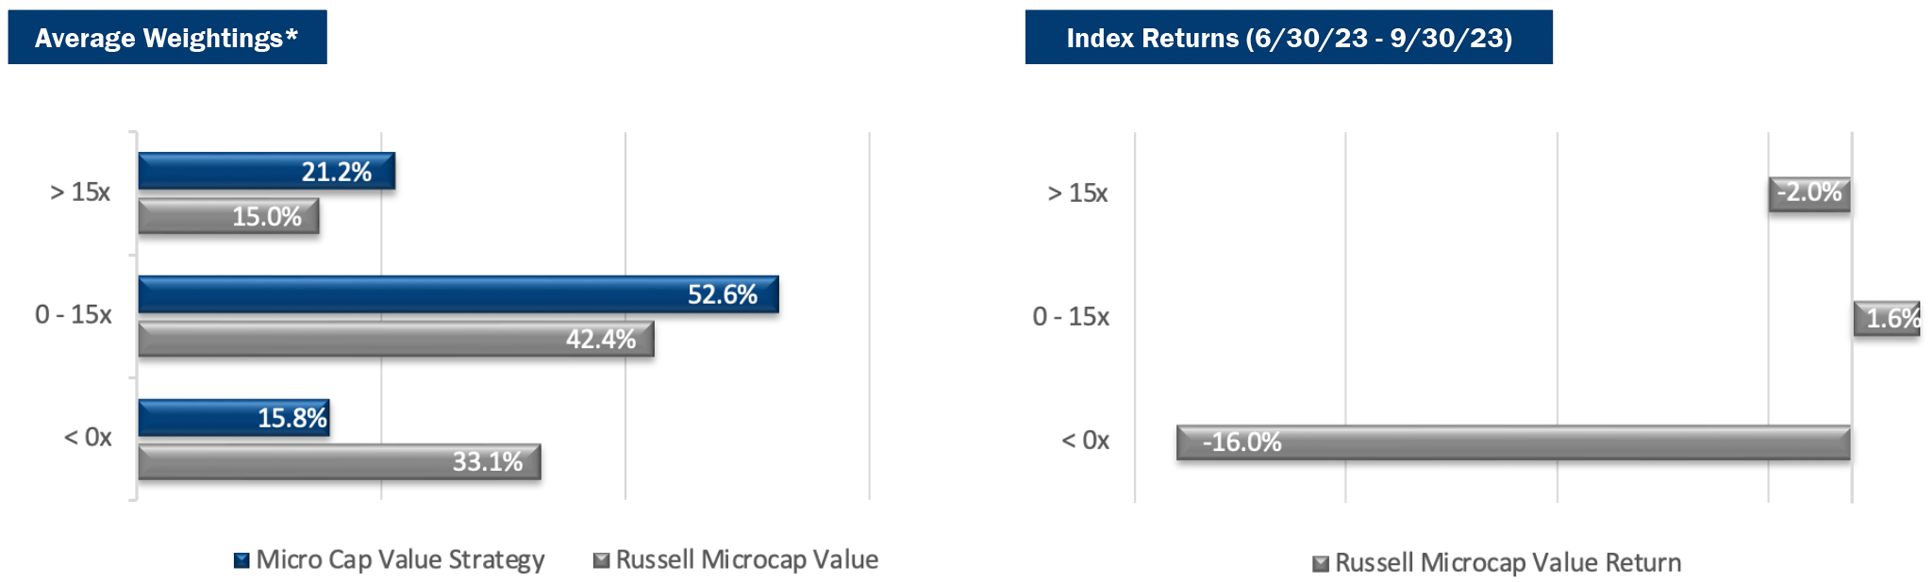
*P/E ratios are based on analyst estimates for the current fiscal year, including both completed and estimated quarterly results. Companies that have no earnings estimates have been excluded, and thus the bars may not add up to 100%.
Sector Analysis
The two primary positive drivers of the Strategy’s performance were the Health Care and Consumer Discretionary sectors. Notably, the lack of exposure to Health Care and significant overweighting to Consumer Discretionary resulted in a substantial overall tailwind. The Consumer Discretionary holdings also exhibited positive stock selection scores, further enhancing the Strategy’s overall performance. The two sectors that most negatively impacted the Strategy were Information Technology and Materials. Overweighting the Information Technology sector and the absence of exposure to Materials created a modest headwind. Additionally, subpar stock selection scores in the Information Technology sector further contributed to the detraction in the strategy’s return.

Portfolio Characteristics (as of 9/30/23)

Top Contributors
Top Detractors


Top Contributors
BuildABear Workshop (“BBW”) is a specialty retailer offering an interactive “make your own stuffed animals” experience, with a strong brand affinity. After a small pullback in the stock in the previous quarter, the shares resumed their upward trend of the past few years, increasing by 37% in the quarter. The company continues to prove that the three-year string of highly profitable quarters is more than a post-pandemic stimulus-induced or return-to-the-mall trend. The consistent growth, far reduced seasonality, and significantly improved margins and cash flow are indications of a successful long-term management strategy. We have trimmed this still-large position, but the valuation remains attractive.
Natural Gas Services Group (“NGS”) is a provider of compression equipment to the oilfield industry. The company’s aggressive growth strategy enacted last year to expand its fleet of large horsepower units has led to solid gains in revenue and earnings. Most of NGS’s new equipment is committed to long-term contracts with favorable pricing that should help mitigate any potential downturn. The discretionary nature of the company’s capital spending program offers flexibility to protect the balance sheet.
Profire Energy (“PFIE”), a provider of combustion management systems primarily for the oil and gas industry, has shown strong growth in revenue and profitability over the past two years. Its shares saw a surge in value last quarter and higher commodity prices have spurred a pickup in maintenance activity following a prolonged deferment. While still relatively small, PFIE continues to gain traction in new markets such as food and beverage, battery plants, landfills, and other facilities where heat management is critical. PFIE’s cash-rich balance sheet should improve with the expected pruning of working capital required to support its rapid growth.
Heritage Insurance Holdings (“HRTG”) is a property and casualty insurer. The company has seen benefits from recent legislation in Florida that has reformed the insurance industry, leading to a decrease in widespread fraud related to homeowners insurance. Furthermore, 2023’s lack of substantial storm activity is contributing to a positive impact on earnings. Despite a noteworthy stock price increase year to date, HRTG still trades at a very low PE multiple.
Twin Disc (“TWIN”), a manufacturer of power transmission equipment, reported another quarter of double-digit revenue growth. Moreover, TWIN’s ongoing global footprint rationalization helped deliver increased profitability. While its own supply chain has improved, customers are still having a difficult time sourcing new engines from third parties, which has boosted TWIN’s refurbishment business, particularly in the energy end market. This should set up a favorable replacement cycle given the lack of industry investment over the past few years and the extended use of existing equipment.
Top Detractors
Rimini Street (“RMNI”) is a third-party provider of enterprise resource planning (ERP) software support and related software and services. In late July, the company was handed a big loss in its longstanding and ongoing legal battles with Oracle, with 10% of RMNI’s business at risk from becoming economically unviable. Also of concern is the increased risk in the minds of existing and potential customers, in addition to the continued legal expenses from ongoing appeals. The company should continue to be profitable and generate cash flow, and trades at an attractive low valuation.
Red Robin Gourmet Burgers (“RRGB”) is a family-friendly hamburger restaurant chain with just over 500 locations, skewed towards the western states. A year ago, when we initiated this position, we believed that the shares were oversold largely due to spiking food commodity costs. After initial strong performance, the shares sold off sharply again this quarter, influenced by consumer-related economic concerns. Over the past year, new management has been implementing a growth- and margin-focused plan, and notably has significantly de-risked the balance sheet via two sale-leaseback transactions.
inTest (“INTT”) is a supplier of highly engineered process and test solutions used by a broad range of manufacturers, including semiconductor equipment and tools used in EV production. After a big move up in the stock over the previous three quarters (during which time we significantly trimmed the position), the shares declined 42% during the quarter. Despite continued strong earnings results and outlook, we believe the selloff was triggered by profit-taking, a slight dampening of analyst EPS estimates due to dilution from a small equity offering in June, and the prolonged wait for an upward inflection in the semiconductor equipment market.
Amtech Systems (“ASYS”), a manufacturer of semiconductor capital equipment, reported earnings that were below expectations caused by ongoing weakness in the industry. Due to high-ticket sales of equipment and its relatively small size, earnings can be lumpy. However, ASYS’s niche market position and being a beneficiary of electric vehicle (EV) proliferation point to potential earnings power. The resulting stock reaction can be significant, as it was during the last semicap equipment upcycle.
Asure Software (“ASUR”) is a provider of Human Capital Management (HCM) software and services. After strong returns in the previous few quarters, the shares slid for the second straight quarter. Strong earnings results that had driven the stock higher continue, but two items have caused recent pullbacks. First, ASUR announced a secondary equity offering (in which we participated) that was used to pay off high-cost debt. Second, ASUR was painted in a bad light for helping customers file for the controversial pandemic-era Employee Retention Tax Credit. We believe the first factor is a net positive, and the second is likely overblown.
Market Outlook
During the third quarter, small cap value stocks performed in-line with large cap growth stocks, a sharp contrast from the first half of the year when large cap growth stocks significantly outperformed their small cap counterparts. In July, small cap value stocks rebounded, buoyed by a spike in regional bank shares. However, concerns over rising interest rates led to a market downturn in the last two months of the quarter. Energy was the best performing sector during the quarter, driven by a spike in oil prices.
We have concerns about the pace of economic growth in the coming year as the labor market continues to show signs of cooling. The final GDP reading for second quarter showed 2.1% growth, slightly trailing the first quarter growth of 2.2%. The consensus estimates for third quarter GDP is 2.3%. Even though the manufacturing sector continues to contract, there are reasons for optimism. The Institute for Supply Management’s PMI ticked up to 49.0 in September from 47.6 in August. This increase, albeit modest, signals a potential deceleration in manufacturing contraction.
The core PCE Index, the preferred inflation gauge, rose by 0.1% in August compared to the previous month, with an annualized reading of 3.9%, the slowest pace in two years. However, the impact of rising energy prices was felt in the headline PCE Index, which rose a sharp 0.4%, the biggest increase in seven months. The 10-year Treasury yield stood at 4.57%, well off the pandemic lows of under 1.0%. This raises the concern that higher borrowing costs might stifle economic growth.
On the jobs front, the U.S. economy added a solid 336,000 jobs in September versus expectations of 163,000. The unemployment rate held steady at 3.8% versus expectations of 3.7%. The JOLTS Job Openings Index for August came in strong at 9.6 million versus the prior month of 8.9 million. However, hourly wages rose only 0.2%, marking the smallest gain in 18 months.
We are concerned about economic growth over the balance of the year and into 2024 given elevated interest rates, the softening labor market as discussed above, and the tapering off of new bank loan demand. The Fed has made significant progress in bringing down inflation to more reasonable levels, though it remains to be seen if they will need to enact additional rate hikes. Current elevated interest rates and the higher cost of capital should drive more investors to focus on value stocks that are less dependent on seeking additional financing from the market.
PRCP GIPS Report

*2021 Composite Dispersion excluding one account with a significant cash flow was 0.2%.
Disclosures
Pacific Ridge Capital Partners, LLC (“Pacific Ridge”, “PRCP”, or “the Firm”) is a 100% employee-owned investment advisor registered with the Securities and Exchange Commission under the Investment Advisors Act of 1940. The Firm was established in June 2010, and has one office located in Lake Oswego, Oregon. Pacific Ridge claims compliance with the Global Investment Performance Standards (GIPS®) and has prepared and presented this report in compliance with the GIPS standards. Pacific Ridge has been independently verified for the periods June 10, 2010 through June 30, 2023. A firm that claims compliance with the GIPS standards must establish policies and procedures for complying with all the applicable requirements of the GIPS standards. Verification provides assurance on whether the firm’s policies and procedures related to composite and pooled fund maintenance, as well as the calculation, presentation, and distribution of performance, have been designed in compliance with the GIPS standards and have been implemented on a firm-wide basis. The Micro Cap Value composite has had a performance examination for the periods June 10, 2010 through June 30, 2023. The verification and performance examination reports are available upon request.
The Micro Cap Value composite was created on June 10, 2010 and incepted on April 1, 2007. Performance from 2007 to 2010 is from portfolios managed at another entity. The Micro Cap Value composite comprises fully discretionary portfolios managed by the Firm invested primarily in a concentrated equity portfolio of smaller companies with market capitalizations similar to those found in the Russell Microcap® Index. Smaller capitalization equities have historically had greater volatility than large capitalization equities. The Strategy ascribes to a disciplined bottom-up fundamental selection process with an emphasis given to the cash flow generating capabilities of a company. The Strategy’s objective is to outperform the Russell Microcap Value Index which is used as our benchmark. Eligible portfolios must be managed for a full calendar month prior to inclusion in the Micro Cap Value composite. Composite dispersion is measured using an asset weighted standard deviation of gross returns of the portfolios included for the entire year. Returns and asset values are stated in US dollars.
The Russell Microcap Value Index measures the performance of the microcap segment of the U.S. equity market. For comparison purposes, the Index is fully invested, which includes the reinvestment of income. The return for the Index does not include any transaction costs, management fees or other costs. It is not possible to invest directly in the Index.
Sources: Pacific Ridge; FactSet Research Systems (“FactSet”); and Russell Investment Group (“Russell”) who is the source and owner of the Russell Index data.
Returns for the Micro Cap Value composite are time-weighted and presented gross and net of management fees and other expenses and includes realized and unrealized gains and losses, cash and cash equivalents and related interest income, and accrued based dividends. Net returns are calculated by deducting the highest annual management fee of 1.50% from the quarterly gross composite return. Performance-based fees are available upon request. All returns are calculated after the deduction of the actual transaction costs incurred during the period.
The fee schedule for separately managed accounts is a flat rate of 1.50%.
The portfolio characteristics, sector weightings and attribution analysis for the Micro Cap Value composite are based on a representative account within the Strategy. The representative account statistics are shown as supplemental information. The Firm maintains a complete list of contributors and detractors to portfolio return as well as a complete list and description of composites and pooled funds, policies for valuing portfolios, calculating performance, and preparing GIPS Reports, all of which are available upon request by contacting Peter Trumbo, Chief Operating Officer/Chief Compliance Officer at (503) 886-8972 or Peter.Trumbo@PacificRidgeCapital.com.
GIPS is a registered trademark of CFA Institute. CFA Institute does not endorse or promote this organization, nor does it warrant the accuracy or quality of the content contained herein.
Top and Bottom Performing Securities represent those security holdings that had the largest positive and negative total contribution to the portfolio return for the quarter. Top and Bottom Economic Sectors represent those sectors that had the largest positive and negative total contribution to the portfolio return. The holdings identified do not represent all the securities purchased, sold or recommended to clients.
In order to maintain consistency when comparing the Micro Cap Value strategy to the Russell benchmark, the Firm utilizes FactSet’s outlier methodology calculations which provide a comparable portfolio characteristic calculation methodology as Russell applies to its indices.
The information provided should not be considered a recommendation to purchase or sell any particular security. There is no assurance that any securities discussed herein will remain in our Strategy at the time you receive this report or that securities sold have not been repurchased. It should not be assumed that any of the holdings discussed herein were or will be profitable or that the investment recommendations or decisions we make in the future will be profitable or will equal the investment performance of the securities discussed herein. Past performance is no guarantee of future results.
Although the statements of fact and data in this report have been obtained from, and are based upon, sources that the Firm believes to be reliable, we do not guarantee their accuracy, and any such information may be incomplete or condensed. All opinions included in this report constitute the Firm’s judgment as of the date of this report and are subject to change without notice. This report is for informational purposes only and is not intended as an offer or solicitation with respect to the purchase or sale of any security.
| Investment Team | Other Professionals | |||
| Mark Cooper, CFA® | President & Portfolio Manager | Peter Trumbo | Chief Operating Officer/Chief Compliance Officer | |
| Dominic Marshall, CFA® | CIO & Senior Portfolio Manager | Mike McDougall | Senior Trader | |
| Ryan Curdy, CFA® | Portfolio Manager | Manisha Thakkar, CFA® | Director of Business Development | |
| Justin McKillip, CFA® | Senior Analyst | Veronica Orazio | Operations Assistant | |
| Adam Wilkie, CFA® | Senior Analyst | |||
| Laura Moon | Analyst |