

Performance Review
The Pacific Ridge Capital Partners Small Cap Value strategy returned -8.2%* during the third quarter ended September 30, 2022, underperforming the Russell 2000® Value Index (“Index”) return of -4.6%.

*For additional performance information, see the related GIPS® Report on the last page.
The strategy’s portfolio characteristics can be significantly different from the Index because we generally invest in smaller-sized and lower-valued stocks, as well as being sector indifferent. This difference is depicted in the charts below.
Size Analysis
The strategy benefitted from a moderate size bias tailwind during the quarter as smaller companies in the Index outperformed larger companies. Those with a market capitalization below the $813 million Index median posted a -2.8% return, versus a -5.0% return for stocks with a market capitalization above the breakpoint level. The Index had 82.4% of its weight above its median market capitalization level compared to 44.0% in the strategy.
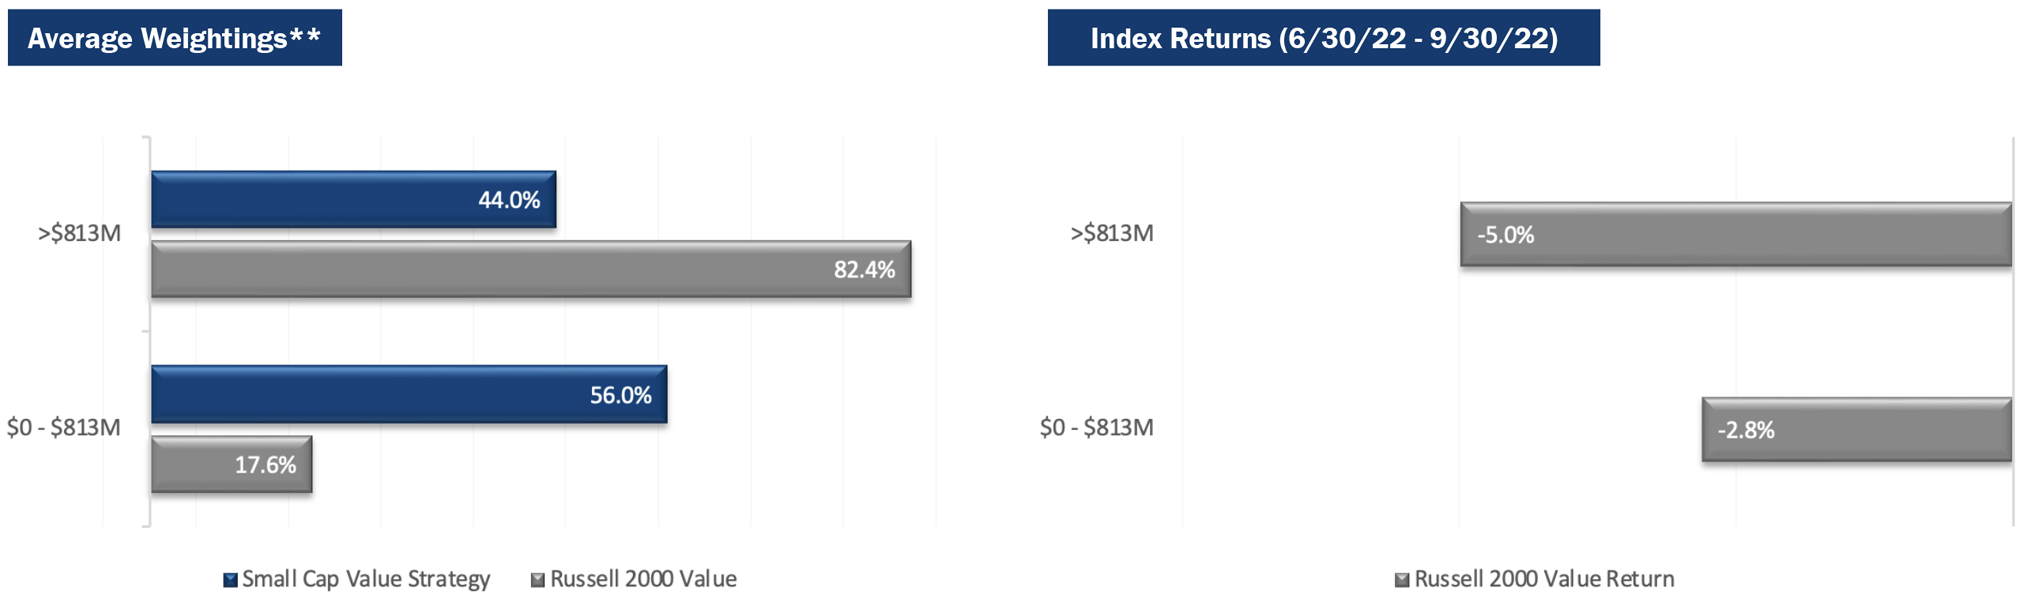
**The size breakpoint in the chart is based on the Index’s median market capitalization at the beginning of the period.
Style Analysis
The strategy benefitted from an overall slight style bias tailwind in the quarter, offset by two opposing factors. The strategy experienced a tailwind from being underweight companies with forward PEs > 15x (12.7% compared to 31.0% in the Index), which returned -8.3%. The strategy also experienced a headwind from an underweight in unprofitable companies: 5.2% versus 15.1% in the Index, which were the best performing companies in the Index with a return of 1.1%.
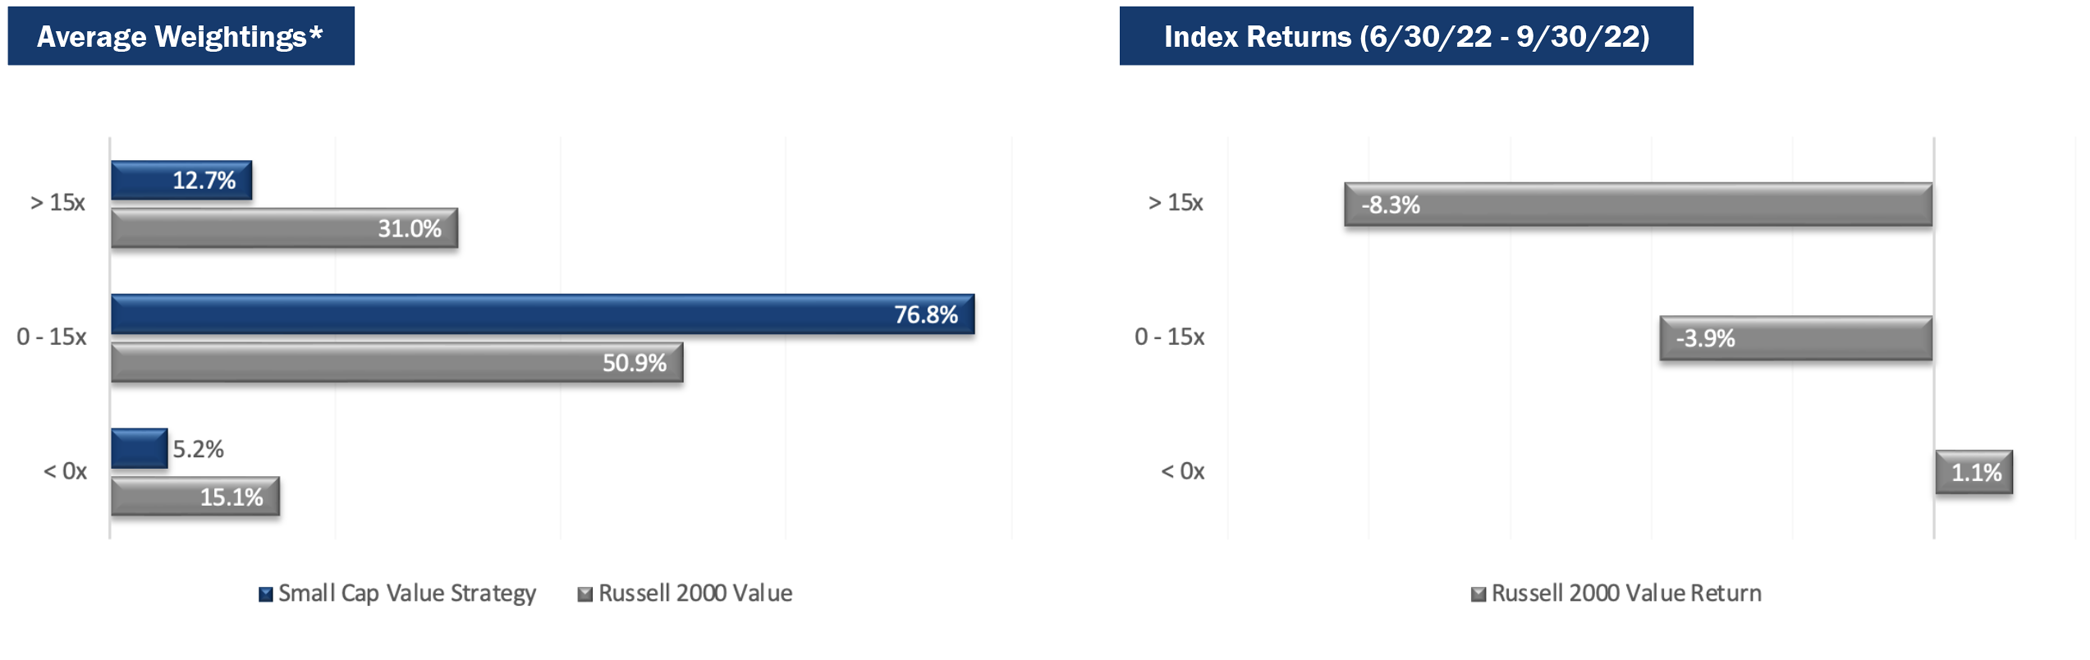
*Companies that have no earnings estimates have been excluded, and thus the bars may not add up to 100%.
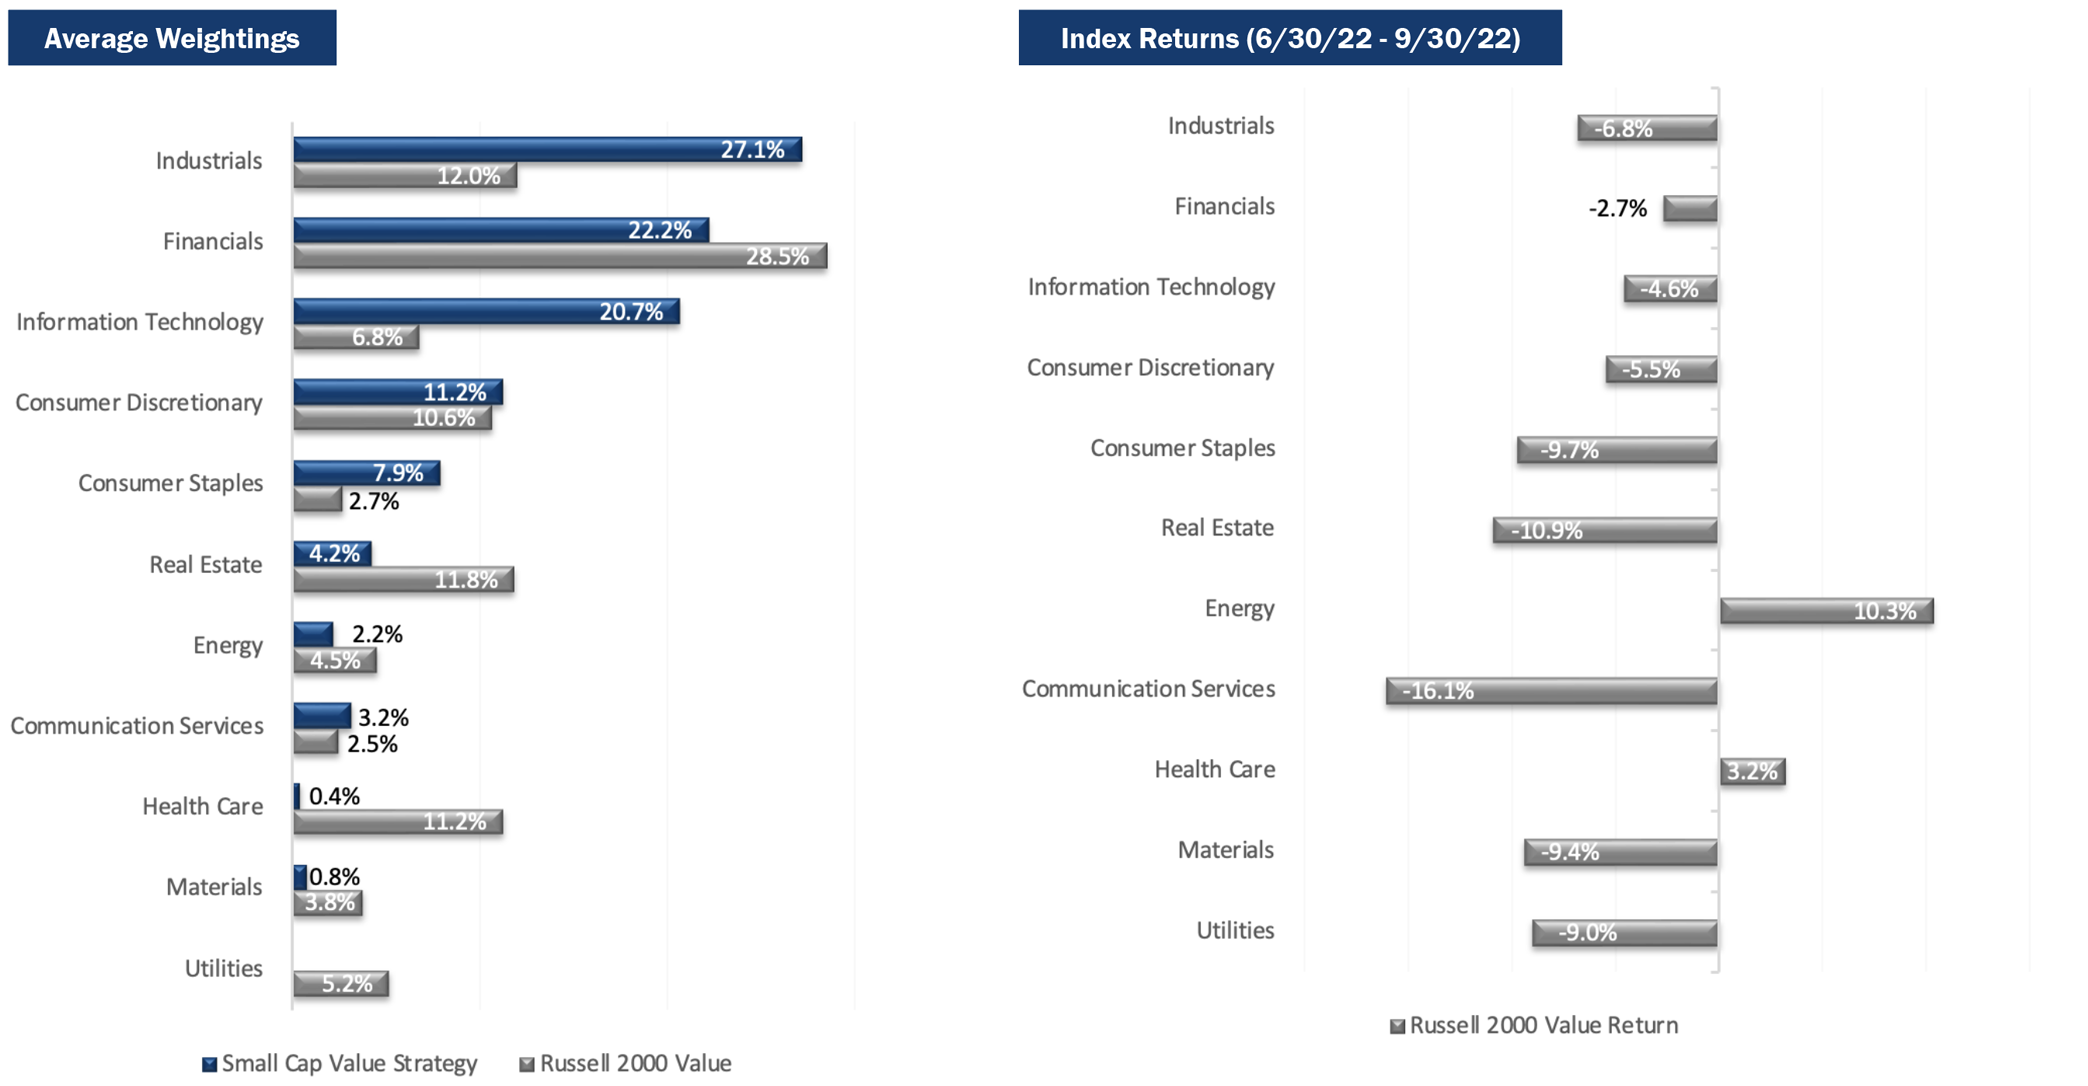
Sector Analysis
The top two contributing sectors to the strategy’s performance in the quarter were Communication Services and Utilities, with a combined benefit of approximaly 90 basis points. The top two sector detractors were Consumer Discretionary and Consumer Staples, combining for approximately 310 basis points of headwind, amplified by an overweight compared to the Index and negative stock selection effect. During the quarter, the Energy and Health Care sectors were the only sectors to post positive returns in the Index.
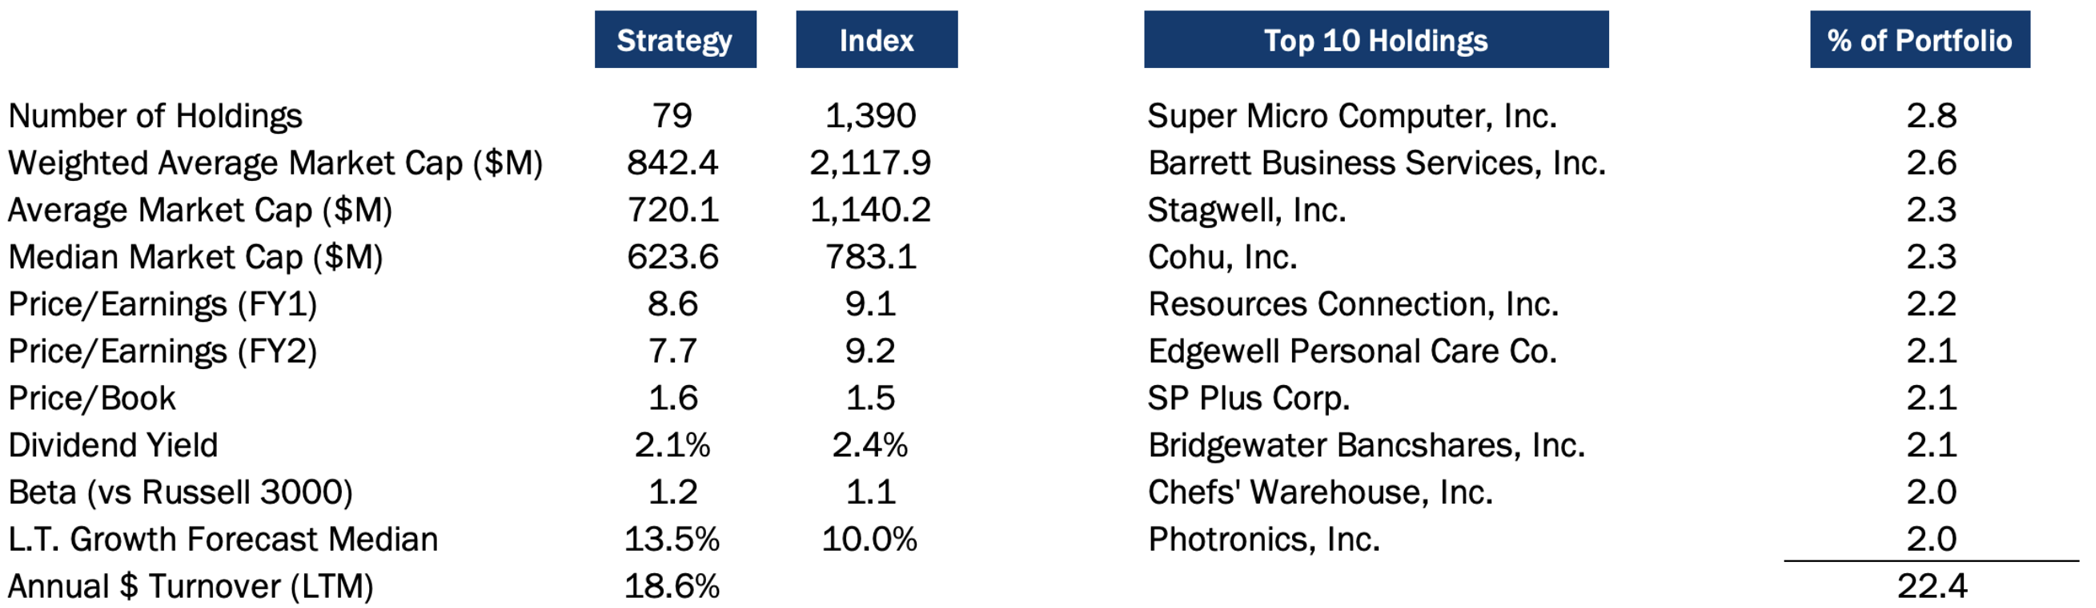
Portfolio Characteristics (as of 9/30/22)
Top Contributors
Top Detractors

Top Contributors
Super Micro Computer, Inc. (“SMCI”), a maker of specialized computer server systems and components, was the largest holding in the strategy. The company continued its string of impressive organic growth results thanks to market share gains, with revenue up 53% in the fiscal fourth quarter (ending June) and 46% for the full year fiscal 2022 period. Meanwhile, operating margins expanded over 300 basis points year-over-year, eclipsing 7%. Despite the increase in price, the stock remains attractively valued, with a PE ratio of 10x trailing results and 7x expectation for the current fiscal year.
Stagwell, Inc. Class A (“STGW”) operates several advertising, media and public relations agencies. It has a larger focus on the digital ad space, which has been outpacing growth of traditional ad mediums. STGW continues to see international growth opportunities and margin expansion after its merger with MDC Partners. With shares trading at 8x EBITDA, we see significant upside from its current price.
Hanger, Inc. (“HNGR”) is the nation’s largest supplier of orthotic and prosthetic devices and the largest clinical provider of services to patients. A long time holding in our portfolio, the company was the target of an LBO at $18.75 per share in late July. The purchase price represented a 30% premium to value of the shares prior to the announcement. As such, HNGR’s shares avoided the dramatic downdraft of the late summer. The cash received from the buyout has been redeployed into other holdings.
Frontline Ltd. (“FRO”) owns and operates a fleet of oil tankers. Shares have seen significant upside in the third quarter and YTD as the market for oil tankers has turned in its favor. The Russian invasion of Ukraine has caused sizable changes to the oil transportation market. Coupled with somewhat tight supply of oil tankers, FRO’s spot prices are skyrocketing, and we do not see this shifting anytime soon. Shares remain discounted to our fair value price and we continue to hold the shares.
Comfort Systems USA, Inc. (“FIX”), a provider of HVAC installation and repair services to the non-residential building market, reported June quarter results that handily beat expectations. Demand for its services in the warehousing, data center and food and pharma distribution markets has been on the rise for the past several years. The company has also been acquiring smaller players in this highly fragmented industry. Though FIX has an impressive track record of growing sales, earnings and free cash flow, we recently exited the position because the market cap exceeded our upper limit.
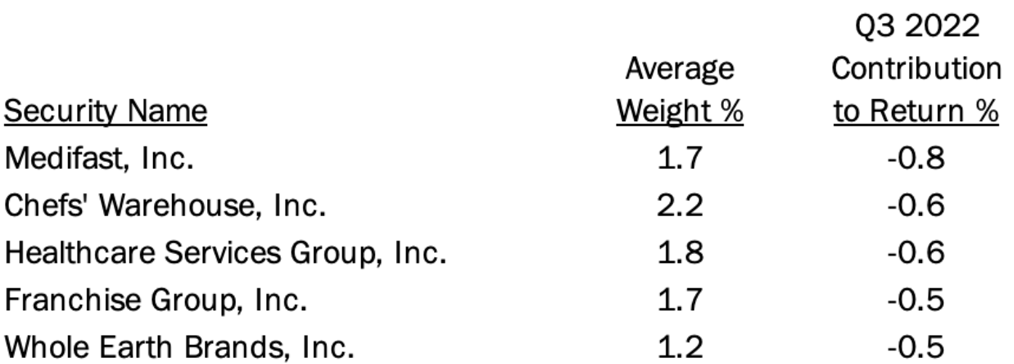
Top Detractors
Medifast, Inc. (“MED”) is a producer and marketer of health food designed to facilitate weight loss. High growth over the past several years has left investors highly sensitized to any slowdown in the company’s trajectory. During its earnings announcement, management cut guidance for the balance of the year because of the impact inflation is having on consumers. As a result, the stock sold off sharply during the quarter. In the past, management handled slowdowns like this, eventually reigniting top-line growth. We expect the same to occur in the future.
Chef’s Warehouse, Inc. (“CHEF”) is the leading supplier of specialty foods to the boutique restaurant industry. The company’s core customers have rebounded well in the post-covid environment, and CHEF used that period to consolidate a significant number of smaller competitors. However, fears of a recessionary economy have caused investors to reprice the shares of food distributors like CHEF. Management has demonstrated an ability to navigate challenging economic times and is likely to do so again in this environment. While the balance sheet carries some debt, the core business should be stable and exit any recession with a commanding market share for its niche business.
Healthcare Services Group, Inc. (“HCSG”) provides housekeeping, laundry and dietary services to long-term care and related health care facilities in the United States. Wage and food inflation have crimped margins in recent months, causing a downward revision in earnings expectations. Also, the company’s core customer base is feeling the impact of inflation, potentially curtailing its revenue stream. HCSG has faced this type of environment several times in its 45-year history, and we believe that the company will use this period to capture greater market share.
Franchise Group, Inc. Class A (“FRG”) is a retailer and franchisor of vitamin shops, pet supplies and discount furniture. The majority of FRG’s products are offered to subprime consumers. With the increase in interest rates and brewing economic concerns, companies with exposure to the subprime consumer market are being penalized. We see a long runway for growth as FRG moves more of its company-owned stores to franchises, while adding new concepts to its business model.
Whole Earth Brands (“FREE”) is a global food company selling low-calorie sweetener products, flavors and ingredients. The company reported earnings during the quarter that beat expectations and guided toward the top end of previous guidance. Despite solid results, the stock traded down through the end of the quarter. Management is competently guiding the company through the challenges posed by high inflation and labor shortages.
Market Outlook
“Extreme volatility” can describe market performance during the past three months ending September 30, 2022. The quarter began on a strong note in July, due in part to investor expectations that the Fed would “pivot” from rate hikes as concerns for inflation and slowdown in economic growth subsided. However, August reports showed inflation remaining at a stubbornly-high 8.3%. Other economic reports were also weak. As a result, August and September were significantly worse than July. Value stocks performed poorer than growth stocks during the third quarter, a reversal from the April-June period.
The Federal Reserve raised its benchmark federal funds rate twice by 75 basis points in their July and September meetings, to a range between 3.0% to 3.25%. This triggered a stock market sell off in August and September.
We continue to have a modest growth outlook for the US economy, though supply chain disruptions, inflationary pressures and rising interest rates have led to a slowdown in the near-term.
GDP decreased 0.6% in 2Q 22, marking the second consecutive quarter of decline. This was driven by decreased private inventory and residential investment. Construction and manufacturing were particularly weak, while consumer spending accelerated compared to the first quarter.
3Q 22 GDP growth is expected to turn slightly positive and near 2%. Sentiment amongst purchasing managers remains upbeat with the September 2022 US manufacturing reading of 50.9, the 28th consecutive month of expansion. However, this is the lowest level since the onset of the pandemic, and several sub-components continue to deteriorate.
New orders, production, and employment have weakened over the past several months as material and labor availability continue to be headwinds. There are also growing concerns of a global economic slowdown. Despite these challenging economic indicators, we continue to find good quality companies at attractive prices.
PRCP GIPS Report

*Information is not statistically meaningful due to an insufficient number of portfolios in the composite for the entire year.
**Information is not statistically meaningful due to an insufficient period of time (36 months).
Disclosures
Pacific Ridge Capital Partners, LLC (“Pacific Ridge”, “PRCP”, or “the Firm”) is a 100% employee owned investment advisor registered with the Securities and Exchange Commission under the Investment Advisors Act of 1940. The Firm was established in June 2010, and has one office located in Lake Oswego, Oregon. Pacific Ridge claims compliance with the Global Investment Performance Standards (GIPS®) and has prepared and presented this report in compliance with the GIPS standards. Pacific Ridge has been independently verified for the periods June 10, 2010 through June 30, 2022. A firm that claims compliance with the GIPS standards must establish policies and procedures for complying with all the applicable requirements of the GIPS standards. Verification provides assurance on whether the firm’s policies and procedures related to composite and pooled fund maintenance, as well as the calculation, presentation, and distribution of performance, have been designed in compliance with the GIPS standards and have been implemented on a firm-wide basis. The Small Cap Value Composite has had a performance examination for the periods June 10, 2010 through June 30, 2022. The verification and performance examination reports are available upon request.
The Small Cap Value composite was created and incepted on August 1, 2010. The Small Cap Value composite comprises fully discretionary portfolios managed by the Firm invested primarily in an equity portfolio of small companies with market capitalizations similar to those found in the bottom three-quarters of the Russell 2000® Index. The strategy ascribes to a disciplined bottom-up fundamental selection process with an emphasis given to the cash flow generating capabilities of a company. The strategy’s objective is to outperform the Russell 2000 Value Index which is used as our benchmark. Eligible portfolios must be managed for a full calendar month prior to inclusion in the Small Cap Value composite. Composite dispersion is measured using an asset weighted standard deviation of gross returns of the portfolios included for the entire year. Returns and asset values are stated in US dollars.
The Russell 2000 Value Index measures the performance of the Russell 2000 companies with lower price-to-book ratios and lower forecasted growth values. For comparison purposes, the index is fully invested, which includes the reinvestment of income. The return for the index does not include any transaction costs, management fees or other costs.
Sources: Pacific Ridge; FactSet Research Systems (“FactSet”); and Russell Investment Group (“Russell”) who is the source and owner of the Russell Index data.
Returns for the Small Cap Value composite are presented gross and net of management fees and other expenses and includes realized and unrealized gains and losses, cash and cash equivalents and related interest income, and accrued based dividends. Net returns are calculated by deducting the highest annual management fee of 1.00% from the quarterly gross composite return. Performance-based fees are available upon request. All returns are calculated after the deduction of the actual trading expenses incurred during the period. The management fee schedule and total expense ratio for the Small Cap Value Fund, which is included in the composite, are 1.00% on all assets and 1.25%, respectively, as of the most recent audit. Total fees for the fund may not exceed 1.25% annually.
The fee schedule for separately managed accounts is a flat rate of 1.00%.
The portfolio characteristics, sector weightings and attribution analysis for the Small Cap Value composite are based on a representative account within the strategy. The representative account statistics are shown as supplemental information. The Firm maintains a complete list of contributors and detractors to portfolio return, as well as a complete list and description of composites and pooled funds, policies for valuing portfolios, calculating performance, and preparing GIPS Reports, all of which are available upon request by contacting Peter Trumbo, Chief Operating Officer/Chief Compliance Officer at (503) 886-8972 or Peter.Trumbo@PacificRidgeCapital.com.
GIPS is a registered trademark of CFA Institute. CFA Institute does not endorse or promote this organization, nor does it warrant the accuracy or quality of the content contained herein.
Top and Bottom Performing Securities represent those security holdings that had the largest positive and negative total contribution to the portfolio return for the quarter. Top and Bottom Economic Sectors represent those sectors that had the largest positive and negative total contribution to the portfolio return. The holdings identified do not represent all the securities purchased, sold or recommended to clients.
In order to maintain consistency when comparing the Small Cap Value strategy to the Russell benchmark, the Firm utilizes FactSet’s outlier methodology calculations which provide a comparable portfolio characteristic calculation methodology as Russell applies to its indices.
The information provided should not be considered a recommendation to purchase or sell any particular security. There is no assurance that any securities discussed herein will remain in our strategy at the time you receive this report or that securities sold have not been repurchased. It should not be assumed that any of the holdings discussed herein were or will be profitable or that the investment recommendations or decisions we make in the future will be profitable or will equal the investment performance of the securities discussed herein. Past performance is no guarantee of future results.
Although the statements of fact and data in this report have been obtained from, and are based upon, sources that the Firm believes to be reliable, we do not guarantee their accuracy, and any such information may be incomplete or condensed. All opinions included in this report constitute the Firm’s judgment as of the date of this report and are subject to change without notice. This report is for informational purposes only and is not intended as an offer or solicitation with respect to the purchase or sale of any security.
| Investment Team | Other Professionals | |||
| Mark Cooper, CFA® | Co-Senior Portfolio Manager | Peter Trumbo | Chief Operating Officer/Chief Compliance Officer | |
| Dominic Marshall, CFA® | Co-Senior Portfolio Manager | Mike McDougall | Senior Trader | |
| Ryan Curdy, CFA® | Portfolio Manager | Manisha Thakkar, CFA® | Director of Business Development | |
| Justin McKillip, CFA® | Senior Analyst | Veronica Orazio | Operations Assistant | |
| Adam Wilke, CFA® | Senior Analyst | |||
| Laura Moon | Analyst |