

Q3’21 Micro Cap Value Strategy
Market Commentary
Throughout history, we have observed that major centers of economic power are not static, but instead shift policy slowly over the course of centuries. More noticeable changes may happen in as little as a generation that end up reversing course. We have certainly seen evidence of this over the past few decades with the People’s Republic of China. Following the death of Mao Zedong in 1976, the country slowly opened its economy to the world under the leadership of Deng Xiaoping, adopting free market measures that helped fuel rapid economic expansion following the failed Great Leap Forward and the Chinese Cultural Revolution. While there remained some semblance of state control over certain industries, this “capitalism with Chinese characteristics” dramatically improved living standards for most Chinese citizens.
This trend continued with China’s admission to the World Trade Organization in 2001. The abundance of low-cost labor gradually led to the country being known as the world’s factory. Over the last forty years, over 700 million rural residents were lifted out of poverty as the economy experienced mass industrialization. Along the way, China has become more interconnected with other global powers despite increased wariness as to how the Chinese Communist Party (CCP) might exploit their newfound economic might.
The critical role that China plays in the global economy has become especially apparent in the past few years following the COVID-19 outbreak and supply chain disruptions. As a politically communist country, CCP leadership can take quick decisive action when a crisis emerges. However, this becomes difficult to sustain when forced to make decisions that might be unpopular with its citizenry and risks destabilizing the party’s political control.
For example, take the efforts by economic planners to curtail the level of debt in their overleveraged economy, a looming crisis that has dogged the country for years. When previous efforts threatened to slow the economy, the government quickly reversed course to maintain sufficient growth. Much of this debt is tied in real estate, the main avenue for savings and wealth creation for China’s burgeoning middle class. This became especially apparent in the past few weeks as Evergrande, a major real estate developer, missed its bond payments. With $300 billion in debt outstanding and a critical role in a segment that represents 25% of China’s GDP, the implications of Evergrande’s insolvency are significant.
While the Chinese government is heavily involved in efforts to cushion the blow to their economy, there is a high risk of a domino effect on derivative impacts from the collapse of Evergrande. Many other real estate developers are dependent on liquidity from capital markets. A crisis of confidence could quickly spiral out of control with consumer demand for new housing units. Contagion to industry suppliers could transition into a broader liquidity squeeze that would ripple through the economy, similar to what the United States experienced during the 2008 Great Financial Crisis. Given the astronomical levels of debt in the Chinese economy, Beijing is desperate to avoid this scenario and will do whatever it can to subsidize domestic stakeholders, with international investors less of a priority. These actions will likely be coupled with Xi Xinping’s desire to gradually reverse some of the free-market policies initiated by Deng Xiaoping. He has made it clear that the long-term goal is not a shift towards capitalism, but back towards socialism and increased governmental control.
In recent years, China has seen a rise in geopolitical tensions with several of their neighbors and international partners, most notably in the area of trade disputes, human rights, intellectual property and the status of Hong Kong and Taiwan. These tensions have ratcheted up in recent weeks with the increased frequency of military flights near the island of Taiwan. Rolling blackouts across much of China have also led to factory shutdowns as the leadership looks to meet pollution standards ahead of key international meetings—a move that risks more disruption to global supply chains. We suspect that as tensions steadily rise, American businesses will be more deliberate in how they source products and invest in capital projects internationally. Like previous shifts in economic power, this realignment will not happen overnight, but over the course of decades, with ramifications on global partnerships and geopolitical relations. We cannot predict the outcome of these shifts; only that that they will occur. As the saying goes, change is the only constant, and the case with China is no exception.

*Preliminary results. For additional performance information, see the related GIPS® Report at the bottom of the page.
Strategy Review
The Pacific Ridge Capital Partners’ Micro Cap Value strategy returned +1.9%* during the third quarter ended September 30, 2021, outperforming the Russell Microcap® Value Index (“Index”) return of -1.8%. Over the trailing one-, three- and five-year periods, the strategy posted an annualized rate of return of +74.5%*, +8.0%* and +14.0%*, respectively, compared to the Index returns of +76.8%, +11.4% and +14.3%. Since inception (4/1/07), the strategy returned +11.4%* on an annualized basis, compared with +7.3% for the Index.
*Preliminary results. For additional performance information, see the related GIPS® Report at the bottom of the page.
Top Contributors and Detractors to Return for Third Quarter 2021**
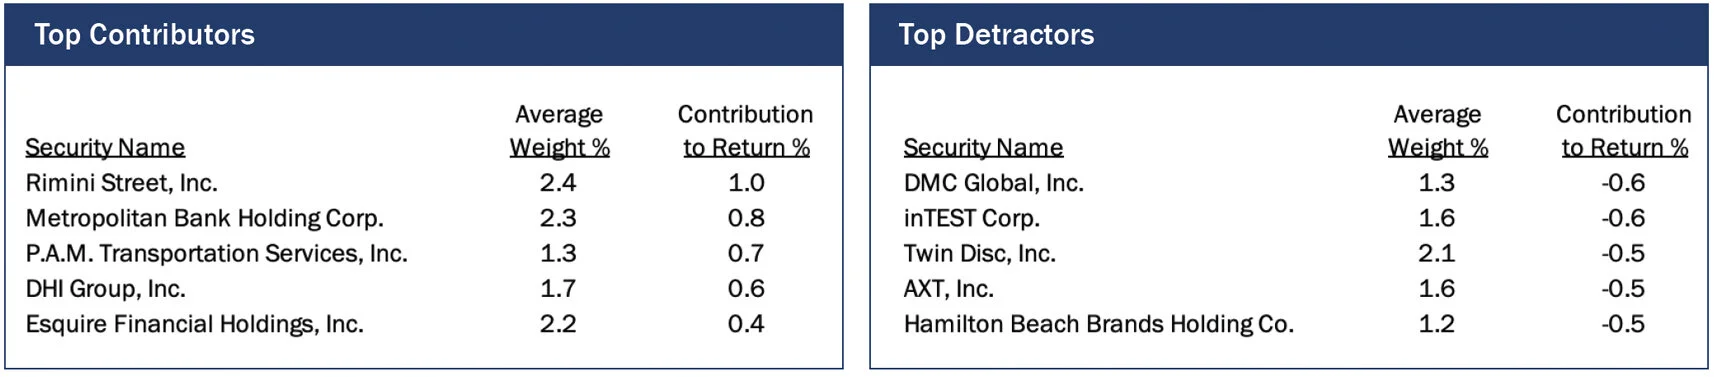
Top Contributors
Rimini Street (“RMNI”) is a provider of support and services for enterprise software. The stock rebounded strongly during the third quarter after a sharp selloff in May following an earnings miss. Their quarterly results were marked by strong sales, although they had a slight miss on EBITDA. Despite strong revenue growth and improving profitability, the company continues to trade at a discount, given their long-running legal battles with Oracle. The diversification of their service offerings continues to drive their backlog and win over skeptics.
Metropolitan Bank Holding (“MCB”) is a Manhattan-based community bank. The stock rallied during the quarter as credit concerns related to the New York City economy and their health care portfolio continued to dissipate. While the company’s balance sheet has grown rapidly over the years, it has been negatively offset by steady compression in net interest margin. Management continues to seek diversification of MCB’s earnings stream though their Global Payments Group segment, adding a fintech element to the business model. In addition, a recent capital raise has provided the company with plenty of dry powder to continue to grow for the next several years.
P.A.M. Transportation Services (“PTSI”) is a dry van truckload carrier. The company benefits from the tight trucking environment, which has pushed rates steadily higher. A massive tailwind created by a lack of drivers and lower fleet counts is driving up industry spot rates as customers struggle to restock inventories. Management is taking advantage of the current high profit environment by reducing leverage through a combination of operating cash flow and the sale of used equipment. Debt paydown remains a primary focus, with a targeted net leverage reduction to 2x from 2.5x.
DHI Group (“DHX”) offers services that help employers find talent under its Dice, ClearanceJobs, and eFinancialCareers brand names. The stock has performed well over the past year as the economy and job growth continues to recover from the pandemic. The company reported solid results during the quarter, including future bookings that grew at a rapid pace (an encouraging indicator of prospective revenue.) Early in the quarter, the eFinancialCareers management team segment acquired a majority stake in that business, eliminating a source of cash burn for the corporate parent.
Esquire Financial Holdings (“ESQ”) is a New York based business bank that caters to the legal industry. The stock has performed well over the past several years as the bank continues to be highly profitable, thanks to its low-cost deposit base and branch-light model. Management continues to guide toward loan growth of 20% per year, while the merchant processing business grows at 30%. The market is slowly recognizing ESQ’s sustained profitability and growth metrics that continue to exceed the broader industry, resulting in more respectable valuation multiples.
Top Detractors
DMC Global (“BOOM”) is a manufacturer of oil field service equipment. The stock sold off following earnings results and guidance, both of which were slightly below expectations. A combination of poor forward visibility and a capital raise during the quarter led to a dramatic 30% reduction in forward earnings estimates when compared to recent months. There is a possibility in the near future of an acquisition that will add scale and diversity to the company’s revenue streams. Additionally, the recent upward trend in oil prices should also help BOOM’s bottom line.
inTest (“INTT”) is a manufacturer of thermal management products for the semiconductor industry. The stock sold off during the quarter following a strong run in the past year. While earnings results for the quarter were better than expected, flat earnings guidance disappointed the market. With ongoing shortages in the semiconductor space, the company has a solid pipeline for continued revenue growth into 2022 and 2023.
Twin Disc (“TWIN”) is a manufacturer of power transmission equipment. The company reported earnings that had a combination of positive and negative reporting, though results were slightly better than expected. This was the company’s first quarter of growth in several years, as their end markets were struggling prior to the pandemic. To counter this, the company has invested in product development over the past few years, with a primary focus on electrification. TWIN’s revenue opportunity for electric and hybrid transmissions shows more growth potential than traditional power transmission equipment.
AXT Inc. (“AXTI”) is a key supplier of silicon-alternative semiconductor substrates, such as gallium arsenide (GaAs) and indium phosphide (InP). The stock sold off sharply late in the quarter without any obvious explanation, suggesting that a large shareholder exited their position in an inefficient manner. Quarterly results were reasonable, with earnings easily exceeding estimates and a rise in third quarter guidance. The company appears well positioned in the semiconductor space, with demand expected to be strong for several years, thanks to current chip shortages that are rampant across multiples industries.
Hamilton Beach Brands Holding (“HBB”) is a manufacturer and marketer of small kitchen appliances. The company reported results that included a significant drop in gross margins. While sales rose nicely, it was more than offset by the margin contraction that management blamed on shipping and transportation costs (not an uncommon issue in the current environment). While implementation of price increases is just beginning, it will take time for shipping bottlenecks to be resolved.
**Past performance does not guarantee future results. The holdings identified do not represent all the securities purchased, sold or recommended to clients. Top contributors and detractors to return represent those securities that had the largest positive and negative total contribution to the overall portfolio return for the quarter. A complete list of contributors to portfolio return can be obtained by contacting Peter Trumbo, Chief Compliance Officer, at 503-886-8972 or by email at Peter.Trumbo@PacificRidgeCapital.com. For additional information, see the related GIPS® Report on the last page.
Market Capitalization Analysis
There was a modest size bias headwind during the quarter, as smaller companies in the Index underperformed larger companies. Those with a market cap below $400 million in the Index posted a -3.7% return, versus a -1.2% return for firms with a market cap above $400 million. The strategy had 67.4% of its holdings in companies with a market cap below $400 million, compared to 25.6% for the Index.

Style Analysis
There was a modest value-bias tailwind for profitable companies during the quarter, as stocks with lower PEs outperformed those with higher PEs. Those with a PE ratio below 15x returned +2.3% versus -1.9% for those companies with a PE greater 15x. The strategy had 44.5% of its holdings in companies with a PE greater than 15x compared to 22.9% for the Index. In addition, poor performance of unprofitable companies in the Index created a moderate tailwind, as those stocks posted a -7.5% return, versus a +0.8% return for firms that were profitable. The strategy had 4.7% of its holdings in unprofitable companies, compared to 26.3% for the Index.

Economic Sector Analysis
The strategy’s performance in Financials, Information Technology, and Consumer Discretionary contributed approximately 380 basis points of excess return compared to the Index. However, performance in Materials and Consumer Staples detracted approximately 100 basis points versus the Index. The strategy’s lack of exposure to the Health Care sector contributed approximately 60 basis points of excess return compared to the Index.

Market Outlook
We continue to look for modest growth in the US economy but are wary of hiccups in the near term caused by supply chain disruptions and a shrunken labor pool. The recovery continued at a similar pace in 2Q21 with GDP growing +6.7% driven by increased personal consumption and business re-openings. Sentiment amongst purchasing managers remains positive with the September 2021 US manufacturing PMI reading of 61.1, the 16th consecutive month of expansion. New Orders and Production components remain strong while inventories appear to be building slightly. However, transportation bottlenecks have significantly stalled the pace of deliveries setting up a potential restocking event into next year as the flow of goods improves.
Portfolio Characteristics and Top Ten Holdings (as of 9/30/21)

As always, we continue to search for companies that demonstrate an ability to earn a fair return on capital. We welcome any questions or comments you may have and thank you for your continued support.
Sincerely,
Pacific Ridge Capital Partners
Investment Team Additional Professionals
Mark Cooper, CFA® Co-Senior Portfolio Manager Peter Trumbo Chief Operating/Compliance Officer
Dominic Marshall, CFA® Co-Senior Portfolio Manager Mike McDougall Senior Trader
Ryan Curdy, CFA® Portfolio Manager Manisha Thakkar, CFA® Director of Business Development
Justin McKillip, CFA® Senior Analyst Veronica Orazio Operations Assistant
Adam Boyce, CFA® Senior Analyst
Regulatory Disclosures
The contributors and detractors to return, market capitalization weightings and total effect, economic sector weightings and total effect, portfolio characteristics, and top ten holdings for the Micro Cap Value Composite are based on a representative account within the strategy. The representative account statistics are shown as supplemental information and complement the composite's GIPS® Report as provided on the last page.
The Russell Microcap® Value Index measures the performance of the microcap segment of the U.S. equity market. For comparison purposes, the index is fully invested, which includes the reinvestment of income. The return for the index does not include any transaction costs, management fees or other costs.
In order to maintain consistency when comparing the Micro Cap Value strategy to the Russell benchmark, the Firm utilizes FactSet’s outlier methodology calculations which provide a comparable portfolio characteristic calculation methodology as Russell applies to its indices.
The information provided should not be considered a recommendation to purchase or sell any particular security. There is no assurance that any securities discussed herein will remain in our strategy at the time you receive this report or that securities sold have not been repurchased. It should not be assumed that any of the holdings discussed herein were or will be profitable or that the investment recommendations or decisions we make in the future will be profitable or will equal the investment performance of the securities discussed herein. Past performance is no guarantee of future results.
Although the statements of fact and data in this report have been obtained from, and are based upon, sources that the Firm believes to be reliable, we do not guarantee their accuracy, and any such information may be incomplete or condensed. All opinions included in this report constitute the Firm’s judgment as of the date of this report and are subject to change without notice. This report is for informational purposes only and is not intended as an offer or solicitation with respect to the purchase or sale of any security.
PRCP GIPS Report

Disclosures
Pacific Ridge Capital Partners, LLC (“Pacific Ridge”, “PRCP”, or “the Firm”) is a 100% employee owned investment advisor registered with the Securities and Exchange Commission under the Investment Advisors Act of 1940. The Firm was established in June 2010, and has one office located in Lake Oswego, Oregon. Pacific Ridge claims compliance with the Global Investment Performance Standards (GIPS®) and has prepared and presented this report in compliance with the GIPS standards. Pacific Ridge has been independently verified for the periods June 10, 2010 through September 30, 2021. A firm that claims compliance with the GIPS standards must establish policies and procedures for complying with all the applicable requirements of the GIPS standards. Verification provides assurance on whether the firm’s policies and procedures related to composite and pooled fund maintenance, as well as the calculation, presentation, and distribution of performance, have been designed in compliance with the GIPS standards and have been implemented on a firm-wide basis. The Micro Cap Value Composite has had a performance examination for the periods June 10, 2010 through September 30, 2021. The verification and performance examination reports are available upon request.
The Micro Cap Value composite was created on June 10, 2010 and incepted on April 1, 2007. The Micro Cap Value composite comprises fully discretionary portfolios managed by the Firm invested primarily in a concentrated equity portfolio of smaller companies with market capitalizations similar to those found in the Russell Microcap® Index. The strategy ascribes to a disciplined bottom-up fundamental selection process with an emphasis given to the cash flow generating capabilities of a company. The strategy’s objective is to outperform the Russell Microcap® Value Index which is used as our benchmark. Eligible portfolios must be managed for a full calendar month prior to inclusion in the Micro Cap Value composite. Prior to June 10, 2010 the performance represents the track record established by the Portfolio Management Team while affiliated with prior firms. The portability of the prior track record has been reviewed by Ashland Partners & Company LLP. Composite dispersion is measured using an asset weighted standard deviation of gross returns of the portfolios included for the entire year. Returns and asset values are stated in US dollars.
The Russell Microcap® Value Index measures the performance of the microcap segment of the U.S. equity market. For comparison purposes, the index is fully invested, which includes the reinvestment of income. The return for the index does not include any transaction costs, management fees or other costs.
Sources: Pacific Ridge; FactSet Research Systems (“FactSet”); and Russell Investment Group (“Russell”) who is the source and owner of the Russell Index data.
Returns for the Micro Cap Value composite are presented gross and net of management fees and other expenses and includes realized and unrealized gains and losses, cash and cash equivalents and related interest income, and accrued based dividends. Net returns are calculated by deducting the highest annual management fee of 1.50% from the quarterly gross composite return. Performance-based fees are available upon request. All returns are calculated after the deduction of the actual transaction costs incurred during the period. The management fee schedule and total expense ratio for the Micro Cap Value Fund, which is included in the composite, are 1.50% on all assets and 1.68%, respectively, as of the most recent audit. Total fees for the fund may not exceed 1.75% annually.
The fee schedule for separately managed accounts is a flat rate of 1.50%.
The portfolio characteristics, sector weightings and attribution analysis for the Micro Cap Value composite are based on a representative account within the strategy. The representative account statistics are shown as supplemental information. The Firm maintains a complete list and description of composites and pooled funds, policies for valuing portfolios, calculating performance, and preparing GIPS Reports which are available upon request by contacting Peter Trumbo, Chief Compliance Officer at (503) 886-8972 or Peter.Trumbo@PacificRidgeCapital.com.
GIPS® is a registered trademark of CFA Institute. CFA Institute does not endorse or promote this organization, nor does it warrant the accuracy or quality of the content contained herein.
Top 5 and Bottom 5 Performing Securities represent those security holdings that had the largest positive and negative total contribution to the portfolio return. Top 3 and Bottom 3 Economic Sectors represent those sectors that had the largest positive and negative total contribution to the portfolio return.
In order to maintain consistency when comparing the Micro Cap Value strategy to the Russell benchmark, the Firm utilizes FactSet’s outlier methodology calculations which provide a comparable portfolio characteristic calculation methodology as Russell applies to its indices.
The information provided should not be considered a recommendation to purchase or sell any particular security. There is no assurance that any securities discussed herein will remain in our strategy at the time you receive this report or that securities sold have not been repurchased. It should not be assumed that any of the holdings discussed herein were or will be profitable or that the investment recommendations or decisions we make in the future will be profitable or will equal the investment performance of the securities discussed herein. Past performance is no guarantee of future results.
Although the statements of fact and data in this report have been obtained from, and are based upon, sources that the Firm believes to be reliable, we do not guarantee their accuracy, and any such information may be incomplete or condensed. All opinions included in this report constitute the Firm’s judgment as of the date of this report and are subject to change without notice. This report is for informational purposes only and is not intended as an offer or solicitation with respect to the purchase or sale of any security.