

Q3’20 Small Cap Value Strategy
Market Commentary
There is a reason we use the term “business cycle.” Over time, we see periods of expanding economic growth and intermittent recessions. Fortunately, we have automatic stabilizers in our economic system that can smooth out these business cycle fluctuations, including unemployment benefits and progressive income tax rates. While these tools can’t completely blunt the deleterious impacts of job losses and reduced income, they are vital to those without adequate alternative financial resources.
The Federal Reserve also provides a manual form of economic stimulus through its monetary policy; specifically, the overnight rates that the Fed lends to banks. This impacts the accessibility of credit within the financial system. The lower the interest rate on loans, the more credit becomes available and the more businesses are willing to borrow and invest.
In the late 1980s, we became accustomed to a more aggressive form of monetary stimulus. Led by then Chairman Alan Greenspan, the Fed began increased its bond purchases, including lower quality instruments than they typically had bought. They took this aggressive action when equity markets experienced a decline of greater than 20%, with the intention of reducing the volatility of both the business cycle and the capital markets. This bond-buying spree limited the downside in equities and lower quality bonds and became known as the “Greenspan put.” During the great financial crisis, it also became associated with his successor, Ben Bernanke.
Our current economic crisis is unlike anything our country has ever experienced. The aggressive actions towards limiting the spread of COVID-19 resulted in a previously unthinkable 31.4% decline in GDP. In addition to the recent trend of quantitative easing and newer policy tools such as the Main Street Lending Facility, Congress and the Administration passed an unprecedented economic stimulus package designed to mitigate the effects of an economic shutdown. While equity markets experienced a sharp selloff late in the first quarter, they came roaring back as consumers benefited from deferred loan payments, bans on evictions and direct cash payments from the Treasury. Based on how this program successfully boosted consumer spending, pressure remains for additional stimulus.
No one will argue that fiscal stimulus is a necessary prescription for any sharp decline in economic activity. These policies stimulate near-term economic activity, prevent job losses and provide support for capital markets. However, there’s a downside to monetary policy like the Greenspan or Bernanke put. These measures can create the expectation that the Fed will always come to the rescue with similar put-type solutions—and grow them in size and scope. While the Fed can allow the bonds they purchase to simply mature, fiscal stimulus adds to the national debt and must be repaid at some point in the future. There are competing arguments as to how consequential this is; specifically, are increasing debt levels inflationary or deflationary. Most concerning, Fed policy like the Greenspan put risks the creation of investor complacency. If economic activity declines, Congress will face substantial pressure to act aggressively to solve the problem.
The next two quarters will be a crucial period for the capital markets. The results of the US Presidential election and progress towards a Covid vaccine will provide a backdrop for the Fed and Congress to decide if more fiscal stimulus is needed, which will invariably move the equity markets. In any event, the valuation disparity between small companies and large companies should continue to shrink in the face of a recovering economy.
Strategy Review
The Pacific Ridge Capital Partners’ Small Cap Value strategy returned 1.9%* during the third quarter of 2020, trailing the 2.6% return of the Russell 2000® Value Index (“Index”). Over the one-, three- and five-year periods, the strategy returned -19.9%*, -8.6%* and 1.3%* (annualized), respectively, compared to the Index returns of -14.9%, -5.1% and 4.1%. Since inception on August 1, 2010, the strategy has returned 7.1%* annually versus 7.2% for the Index.

Top Contributors and Detractors to Return*

Top Contributors
Textainer Group Holdings Limited (“TGH”), an intermodal freight container lessor, rallied strongly during the latter half of the year. The company recently announced completion of their $25 million share repurchase plan and authorized an additional $50 million in buybacks. The shift in the economy from services to goods had a positive impact on container lessors, as well as the slower pace of container production. TGH is expected to benefit in the coming years from renewal of expiring leases at more favorable rates.
CAI International (“CAI”), an intermodal freight container leasing and management company, continued its rally during the quarter following a sharp drop earlier in the year. The company recently announced that utilization is once again approaching 100%, and they have leased nearly all of their container inventory. Furthermore, CAI is expecting an increase in their book value by year end, based on the commencement of favorable contracts.
Bed Bath & Beyond (“BBBY”) is an operator of retail stores specializing in domestic merchandise and home furnishings. The stock has been quite volatile over the past few years as new management was brought in to right the ship and clean up their balance sheet. A non-core division was sold off at an attractive valuation and much of senior management was replaced. Rapid growth through their digital channel has helped offset weak brick and mortar sales.
Comfort Systems (“FIX”), a provider of HVAC installation, maintenance and repair services, substantially beat second quarter earnings estimates. While certain sub-segments of the company’s customer base are weaker (specifically, hospitality and multifamily), FIX’s focus on the industrial market and related strength within that economic sector helped propel strong demand in the quarter.
Sterling Construction (“STRL”) is a construction company that focuses on commercial, residential and civil infrastructure projects. The company reported a strong quarter that validated the success of their acquisition in the prior year. With little impact from Covid-19, revenue and cash flow easily exceeded expectations. Guidance was recently reinstated as homebuilders have solidified their near-term plans, thanks to the rebounding economy. With strong cash generated to date, STRL should easily cover their scheduled debt payments over the remainder of this year and into 2021.
Top Detractors
Heritage Insurance (“HRTG”), a property and casualty insurer, sold off late in the quarter despite reporting solid earnings results in August. While in the midst of hurricane season, one major storm that struck the mainland was in Louisiana and Mississippi where they have no policy coverage. HRTG provided a very positive update in their quarterly earnings call and in subsequent road-shows as they continue to expand their relationships with larger insurers in an effort to drive premium growth.
Rimini Street (“RMNI”), a company that specializes in providing third-party software support services, was added to the strategy during the quarter. RMNI provides similar support services as large software providers but at a fraction of the cost. The stock traded lower during the quarter following a secondary offering and pre-trial rulings related to ongoing litigation with Oracle. While the legal dispute is likely to continue for a number of years, there is substantial upside given the opportunity for revenue growth and operating margin expansion.
Universal Electronics (“UEIC”) is a provider of remote controls and other home entertainment technologies. The company reported revenues that were below expectations, although improved margins helped earnings and EBITDA beat consensus. Forward guidance was disappointing as Covid-19 has impacted the willingness of consumers to have a technician in their home to set up a new system. We feel that the revenue hit from these installation delays is temporary.
Ichor Holdings (“ICHR”) is a designer and manufacturer of fluid delivery subsystems for semiconductor capital equipment. Based on commentary from the company’s largest customers, demand remains strong. However, many stocks in the space declined sharply in early September based on trade tensions with China. We believe the market overreacted to this news and to ICHR in particular. The shares have only recovered a fraction of their sell-off compared to their large-cap customers that fully retraced their pullbacks.
PC Connection (“CNXN”), a provider of IT products and services, saw its stock decline following their earnings announcement in early August. The company’s results were impacted by reduced demand as a result of the pandemic. Additionally, the ongoing implementation of an enterprise resource planning system increased expenses and presented obstacles to near-term sales execution, ultimately contributing to the decline. While revenue has trended higher in the last few months, CNXN continues to be impacted by reduced demand in the business solutions segment. Earnings estimates have been lowered, although demand may increase from delayed investments once the pandemic has passed.
*Past performance does not guarantee future results. The holdings identified do not represent all the securities purchased, sold or recommended to clients. Top contributors and detractors to return represent those securities that had the largest positive and negative total contribution to the overall portfolio return for the quarter. A complete list of contributors to portfolio return can be obtained by contacting Peter Trumbo, Chief Compliance Officer, at 503-886-8972 or by email at Peter.Trumbo@PacificRidgeCapital.com. For additional information, see the related GIPS® compliant presentation on the last page.
Market Capitalization Analysis
There was a moderate size bias headwind during the quarter as larger companies in the Index outperformed smaller companies. Those with a market cap under $1 billion in the Index returned 0.2%, versus a return of 3.4% for companies with a market cap above $1 billion. The strategy had 77.9% of its holdings in companies with a market cap below $1 billion, compared to 29.8% for the Index.

Style Analysis
There was no distinguishable value-bias during the quarter, as stocks with higher P/Es slightly underperformed those with lower P/Es. Performance of unprofitable companies provided a slight headwind, as those companies returned 5.1% versus a return of 2.0% for profitable companies. The strategy had 13.4% of its holdings in unprofitable companies, compared to 21.2% for the Index.

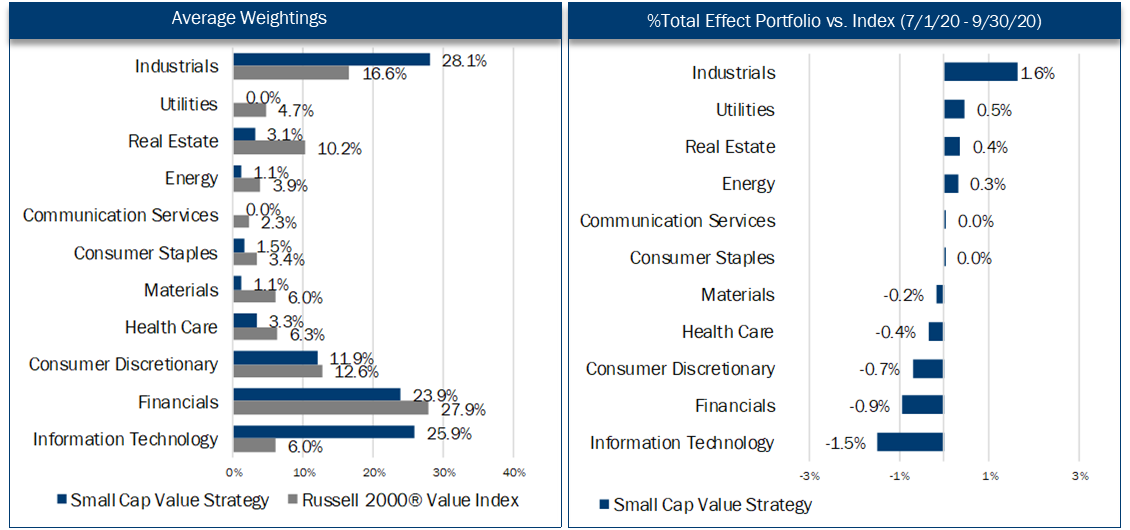
Economic Sector Analysis
The strategy’s performance in Industrials contributed approximately 160 basis points of excess return compared to the Index. However, performance in Information Technology, Financials, and Consumer Discretionary detracted approximately 310 basis points versus the Index. The strategy’s lack of exposure to the Utilities sector contributed an additional 50 basis points of excess return versus the Index.

Market Outlook
The economy snapped back in the third quarter of 2020 following COVID-19 related shutdowns that drove a 31.4% decline in GDP during the second quarter. While third quarter GDP is expected to show significant growth, the sustainability of the recovery is clouded by uncertainties related to the virus, fiscal policy, and the upcoming election. We remain cautious in the near-term particularly given concerns about the length of the pandemic.
As always, we continue to search for companies that demonstrate an ability to earn a fair return on capital. We welcome any questions or comments you may have and thank you for your continued support.
Sincerely,
Pacific Ridge Capital Partners
Investment Team Additional Professionals
Mark Cooper, CFA® Co-Senior Portfolio Manager Peter Trumbo Chief Operating/Compliance Officer
Dominic Marshall, CFA® Co-Senior Portfolio Manager Mike McDougall Senior Trader
Ryan Curdy, CFA® Portfolio Manager Tammy Wood Director, Marketing & Business Development
Justin McKillip, CFA® Senior Analyst Veronica Orazio Operations Assistant
Adam Boyce, CFA® Senior Analyst
Regulatory Disclosures
The contributors and detractors to return, market capitalization weightings and total effect, economic sector weightings and total effect, portfolio characteristics, and top ten holdings for the Small Cap Value Composite are based on a representative account within the strategy. The representative account statistics are shown as supplemental information and complement the composite's GIPS® disclosure presentation as provided on the last page.
The Russell 2000® Value Index measures the performance of the Russell 2000 companies with lower price-to-book ratios and lower forecasted growth values. For comparison purposes, the Index is fully invested, which includes the reinvestment of income. The return for the Index does not include any transaction costs, management fees or other costs.
In order to maintain consistency when comparing the Small Cap Value strategy to the Russell benchmark, the Firm utilizes FactSet’s outlier methodology calculations which provide a comparable portfolio characteristic calculation methodology as Russell applies to its indices.
The information provided should not be considered a recommendation to purchase or sell any particular security. There is no assurance that any securities discussed herein will remain in our strategy at the time you receive this report or that securities sold have not been repurchased. It should not be assumed that any of the holdings discussed herein were or will be profitable or that the investment recommendations or decisions we make in the future will be profitable or will equal the investment performance of the securities discussed herein. Past performance is no guarantee of future results.
Although the statements of fact and data in this report have been obtained from, and are based upon, sources that the Firm believes to be reliable, we do not guarantee their accuracy, and any such information may be incomplete or condensed. All opinions included in this report constitute the Firm’s judgment as of the date of this report and are subject to change without notice. This report is for informational purposes only and is not intended as an offer or solicitation with respect to the purchase or sale of any security.

Disclosures
Pacific Ridge Capital Partners, LLC (“Pacific Ridge”, “PRCP”, or “the Firm”) is a 100% employee owned investment advisor registered with the Securities and Exchange Commission under the Investment Advisors Act of 1940. The Firm was established in June 2010, and has one office located in Lake Oswego, Oregon. Pacific Ridge claims compliance with the Global Investment Performance Standards (GIPS®) and has prepared and presented this report in compliance with the GIPS standards. Pacific Ridge has been independently verified for the periods June 10, 2010 through June 30, 2020. A firm that claims compliance with the GIPS standards must establish policies and procedures for complying with all the applicable requirements of the GIPS standards. Verification provides assurance on whether the firm’s policies and procedures related to composite and pooled fund maintenance, as well as the calculation, presentation, and distribution of performance, have been designed in compliance with the GIPS standards and have been implemented on a firm-wide basis. The Small Cap Value Composite has had a performance examination for the periods June 10, 2010 through June 30, 2020. The verification and performance examination reports are available upon request.
The Small Cap Value composite was created and incepted on August 1, 2010. The Small Cap Value composite comprises fully discretionary portfolios managed by the Firm invested primarily in an equity portfolio of small companies with market capitalizations similar to those found in the bottom three-quarters of the Russell 2000® Index. The strategy ascribes to a disciplined bottom-up fundamental selection process with an emphasis given to the cash flow generating capabilities of a company. The strategy’s objective is to outperform the Russell 2000® Value Index which is used as our benchmark. Eligible portfolios must be managed for a full calendar month prior to inclusion in the Small Cap Value composite. Composite dispersion is measured using an asset weighted standard deviation of gross returns of the portfolios included for the entire year. Returns and asset values are stated in US dollars.
The Russell 2000® Value Index measures the performance of the Russell 2000 companies with lower price-to-book ratios and lower forecasted growth values. For comparison purposes, the index is fully invested, which includes the reinvestment of income. The return for the index does not include any transaction costs, management fees or other costs.
Sources: Pacific Ridge; FactSet Research Systems (“FactSet”); and Russell Investment Group (“Russell”) who is the source and owner of the Russell Index data.
Returns for the Small Cap Value composite are presented gross and net of management fees and other expenses and includes realized and unrealized gains and losses, cash and cash equivalents and related interest income, and accrued based dividends. Net returns are calculated by deducting the highest annual management fee of 1.00% from the quarterly gross composite return. Performance-based fees are available upon request. All returns are calculated after the deduction of the actual trading expenses incurred during the period. The management fee schedule and total expense ratio for the Small Cap Value Fund, which is included in the composite, are 1.00% on all assets and 1.08%, respectively, as of the most recent audit. Total fees for the fund may not exceed 1.25% annually.
The fee schedule for separately managed accounts is a flat rate of 1.00%.
The portfolio characteristics, sector weightings and attribution analysis for the Small Cap Value composite are based on a representative account within the strategy. The representative account statistics are shown as supplemental information. The Firm maintains a complete list and description of composites and pooled funds, policies for valuing portfolios, calculating performance, and preparing GIPS Reports which are available upon request by contacting Peter Trumbo, Chief Compliance Officer at (503) 886-8972 or Peter.Trumbo@PacificRidgeCapital.com.
GIPS® is a registered trademark of CFA Institute. CFA Institute does not endorse or promote this organization, nor does it warrant the accuracy or quality of the content contained herein.
Top 5 and Bottom 5 Performing Securities represent those security holdings that had the largest positive and negative total contribution to the portfolio return. Top 3 and Bottom 3 Economic Sectors represent those sectors that had the largest positive and negative total contribution to the portfolio return.
In order to maintain consistency when comparing the Small Cap Value strategy to the Russell benchmark, the Firm utilizes FactSet’s outlier methodology calculations which provide a comparable portfolio characteristic calculation methodology as Russell applies to its indices.
The information provided should not be considered a recommendation to purchase or sell any particular security. There is no assurance that any securities discussed herein will remain in our strategy at the time you receive this report or that securities sold have not been repurchased. It should not be assumed that any of the holdings discussed herein were or will be profitable or that the investment recommendations or decisions we make in the future will be profitable or will equal the investment performance of the securities discussed herein. Past performance is no guarantee of future results.
Although the statements of fact and data in this report have been obtained from, and are based upon, sources that the Firm believes to be reliable, we do not guarantee their accuracy, and any such information may be incomplete or condensed. All opinions included in this report constitute the Firm’s judgment as of the date of this report and are subject to change without notice. This report is for informational purposes only and is not intended as an offer or solicitation with respect to the purchase or sale of any security.