

Performance Review
The Pacific Ridge Capital Partners Small Cap Value strategy (the “Strategy”) returned -2.8%* (-3.0%* net of fees) during the second quarter ended June 30, 2024, outperforming the Russell 2000® Value Index (the “Index”) return of -3.6%.
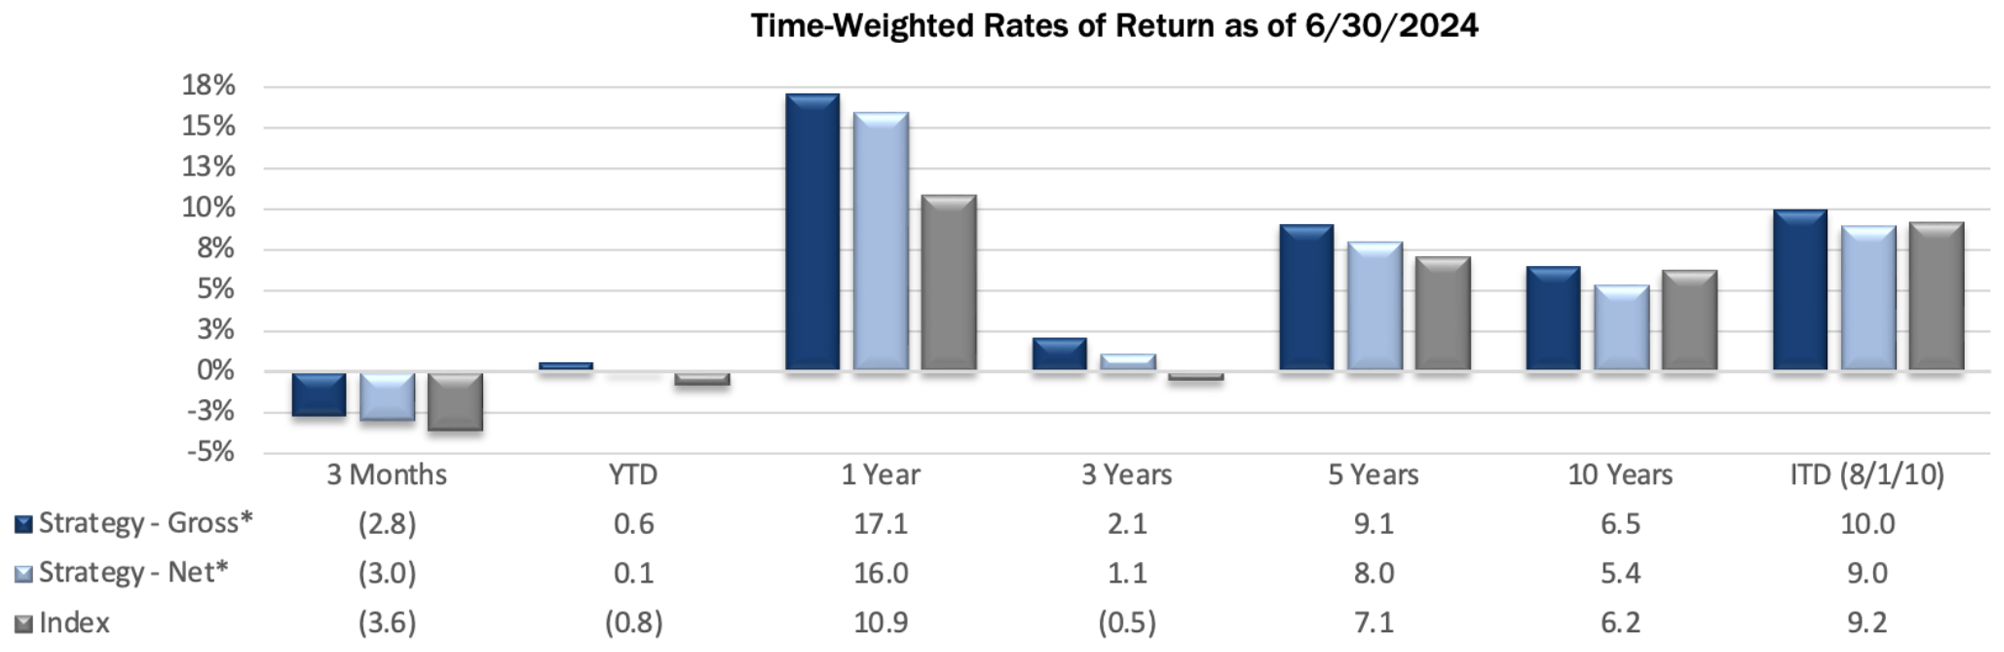
*For additional performance information, see the related GIPS® Report below.
The Strategy’s portfolio characteristics can be significantly different from the Index because we primarily invest in smaller, undervalued stocks and adopt a sector-agnostic approach. You can see these distinctions in the charts below.
Size Analysis
During the quarter, the Strategy faced a slight size bias headwind, where smaller companies in the Index underperformed larger ones. Stocks with a market capitalization below the $838 million Index median saw a return of -5.0%, versus a -3.4% return for stocks with a market capitalization above the breakpoint level. The Index had 13.8% of its weight below the median market capitalization level, while the Strategy had a comparatively higher weight of 50.4%.

**The size breakpoint in the chart is based on the Index’s median market capitalization at the beginning of the period.
Style Analysis
The Strategy received a modest style bias tailwind in unprofitable companies (stocks with a PE ratio less than 0x) during the quarter, as those stocks showed the worst performance in the Index at -7.9%. The Index had a weighting of 13.2% in unprofitable companies compared to the Strategy’s weighting of 4.9%. Profitable companies with relatively low valuations (PE ratio below 15x) posted the second-worst return in the Index at -3.6%, where the Strategy had over half of its holdings, an amount slightly higher than the Index. Companies with a PE ratio above 15x returned -2.4% in the Index, where the Strategy had a similar weighting.

*P/E ratios are based on analyst estimates for the current fiscal year, including both completed and estimated quarterly results. Companies that have no earnings estimates have been excluded, and thus the bars may not add up to 100%.
Sector Analysis
The top two contributing sectors to the Strategy’s performance were Information Technology and Health Care. Overweighting Information Technology alongside positive stock selection scores provided a moderate tailwind. Additionally, the Strategy’s lack of exposure to Health Care, the worst performing sector in the Index, provided a modest tailwind. Conversely, the two sectors that most negatively impacted the Strategy’s performance were Industrials and Materials. Poor stock selection scores in both, combined with an overweight in Industrials, were significant detractors.

Portfolio Characteristics (as of 6/30/24)

Top Contributors
Top Detractors


Top Contributors
Perdoceo Education (“PRDO”) offers undergraduate and graduate programs across several universities. The stock has performed well as demand for higher education has risen amid a loosening labor market. New management has effectively executed key priorities to enhance profitability and address regulatory challenges. With a strong balance sheet and steady free cash flow, the company has numerous options for capital deployment in the coming years.
Benchmark Electronics (“BHE”) is a contract manufacturer with long-term customer relationships in the semiconductor equipment, industrials, medical, and aerospace and defense industries. Despite headwinds from ongoing softness in semi equipment, BHE’s largest industry exposure, management has focused on improving product mix for profitability and keeping controllable expenses down. As a result, on a small year-over-year decline in sales, first quarter operating profit improved 12% and the shares responded with a 32% gain this quarter.
Brinker International (“EAT”), the parent company of Chili’s restaurants, has outperformed the casual dining segment over the past year. The company has successfully increased both revenues and margins during a period of restaurant spending consolidation. The company’s pricing strategy has driven revenue growth despite traffic counts that remain below pre-pandemic levels. Beyond its core Chili’s restaurants, EAT operates an event-driven concept with promising growth opportunities. Financial risk has improved over the past two years, and the company pays a modest dividend.
Daktronics (“DAKT”), a designer and manufacturer of information display systems, continues to execute its turnaround strategy with strong earnings in the latest quarter. Following recent investment in automation and capacity expansion, a looser supply chain has enabled the company to deliver on a substantial backlog that grew throughout the COVID period. Although the end markets remain lumpy from quarter to quarter, particularly for larger sporting arena projects, there remains significant opportunity for continued upgrades, expansions, and extensions into non-action areas such as entryways and concourses to improve the fan experience.
Stagwell (“STGW”) is a global advertising and marketing company. The stock moved higher during the quarter as results for the most recent quarter came in better than expected and management increased its guidance for the remainder of the year. STGW has positioned its business towards the digital ad space, which has seen a cutback in spending over the past few years (though slight improvement has been seen recently). We continue to view the shares as attractively priced and maintain a sizeable weighting in the portfolio.
Top Detractors
Wabash National (“WNC”) is the leading provider of semi-truck trailer dry vans, and increasingly participates in specialty trailers and final-mile delivery. The shares sold off 27% in the quarter over concern about the economy, lower freight levels, and uncertainty about the duration of the downturn. The stock trades for less than 5x PE and 4x EBIT, based on 2023 results, versus 10x and 8x, respectively, on 2024 expectations. We think the market is underappreciating the fact that WNC is a strong company with multiple growth and profitability drivers and remaining highly profitable in this down cycle.
Designer Brands (“DBI”), a shoe retailer under the DSW brand and shoe wholesaler with several popular names in its brand portfolio, saw its stock decline after missing 1Q expectations. The market remains skeptical that the company will hit estimates for 2024 despite management reaffirming guidance for the full year. This skepticism has led to an overreaction to near-term headwinds, causing the shares to trade at a significant discount compared to DBI’s long-term fundamentals and peer multiples. We believe this presents an attractive investment opportunity.
Koppers (“KOP”), an integrated provider of wood preservation technologies, produces railroad ties, powerline poles, and treated lumber. Despite reaffirming full-year guidance, shares declined in the quarter after a slight miss in 1Q expectations. The drop was further influenced by reduced expectations for U.S. home remodeling activity that began in late March. Even with the recent sell-off, shares remain attractive, and we continue to hold them in the Strategy.
Banc of California (“BANC”), a commercial bank based in Santa Ana, CA, completed a reverse merger with PacWest Bancorp last November. This beneficial transaction introduced short-term earnings uncertainty. An accounting adjustment to fair market value related to the merger and lowered full-year guidance led to a decline in the company’s share price during the quarter. Despite these challenges, we continue to maintain our position in BANC, and we see significant upside potential to our target price.
Cooper-Standard (“CPS”), a manufacturer of sealing, fuel, brake delivery, and fluid transfer systems for passenger vehicles, primarily serves large OEMs like Ford, GM, and Stellantis. The stock sold off during the quarter due to a slight earnings miss. However, management highlighted the potential upside to its annual guidance and ongoing cost-cutting measures. Despite investors’ focus on the quarterly miss, CPS is poised to generate substantial cash flow and achieve a reasonable valuation multiple as auto production normalizes in the coming years.
Market Outlook
Mixed economic indicators in areas such as consumer spending and business investment have staved off recession. Investor sentiment has been optimistic, driving up U.S. stock market indices. The strong performance of the Magnificent 7 has led to record levels for large-cap benchmarks, particularly the S&P 500 and Nasdaq. This optimism has widened the divergence in performance between large-cap and small-cap stocks, with investors favoring large caps. In contrast, small-cap stocks have struggled because of higher interest rates and greater concentrations in the Financials sector, driven by concerns about defaults in commercial real estate loans.
In May, the core PCE Index, which excludes food and energy, decreased by 0.2% to 2.6%. This decline brings the Index closer to the Federal Reserve’s year-end target, though it still exceeds the long-term goal of 2.0%. Discretionary components have shown minimal price increases. However, non-discretionary categories such as healthcare and insurance costs remain elevated, resulting in sticky inflation. The June nonfarm payrolls report indicated a slight decline to 206,000 jobs added, down from the revised 218,000 reported for May. Additionally, the unemployment rate in June increased to 4.1%, the first time it has reached this level since November 2021. Wage growth has slowed to 3.9%, the lowest rate in three years.
The ISM Manufacturing PMI contracted to 48.5%, down 0.2% from May, while the ISM Services PMI fell to 48.8%, a significant drop from May’s figure of 53.8%. These indicators suggest a broader economic slowdown in June, with both major sectors of the economy contracting. The final GDP for Q1 2024 increased at an annualized rate of 1.4%, while the Atlanta Federal Reserve forecasts 1.5% growth in Q2 2024.
The economy is slowing, unemployment is gradually rising, and inflation is coming off its highs. The stock market has a greater chance of broadening out once interest rates fall, recognizing the potential of undervalued small-cap stocks that typically perform better in a declining interest rate environment. This has happened previously after the dot com bubble burst and the Fed cut interest rates from 6.5% in 2000 to 1% in 2003, after the 2008 Financial Crisis when the Fed cut interest rates from 5.25% in 2007 to near zero, and during COVID when rates were similarly slashed from 2.25%. The result was strong Russell 2000 performance and small-caps outperforming large-caps.
PRCP GIPS Report

*Information is not statistically meaningful due to an insufficient number of portfolios in the composite for the entire year.
Disclosures
Pacific Ridge Capital Partners, LLC (“Pacific Ridge”, “PRCP”, or “the Firm”) is a 100% employee-owned investment advisor registered with the Securities and Exchange Commission under the Investment Advisors Act of 1940. The Firm was established in June 2010, and has one office located in Lake Oswego, Oregon. Pacific Ridge claims compliance with the Global Investment Performance Standards (GIPS®) and has prepared and presented this report in compliance with the GIPS standards. Pacific Ridge has been independently verified for the periods June 10, 2010 through March 31, 2024. A firm that claims compliance with the GIPS standards must establish policies and procedures for complying with all the applicable requirements of the GIPS standards. Verification provides assurance on whether the firm’s policies and procedures related to composite and pooled fund maintenance, as well as the calculation, presentation, and distribution of performance, have been designed in compliance with the GIPS standards and have been implemented on a firm-wide basis. The Small Cap Value composite has had a performance examination for the periods June 10, 2010 through March 31, 2024. The verification and performance examination reports are available upon request.
The Small Cap Value composite was created and incepted on August 1, 2010. The Small Cap Value composite comprises fully discretionary portfolios managed by the Firm invested primarily in an equity portfolio of small companies with market capitalizations similar to those found in the bottom three-quarters of the Russell 2000® Index. Smaller capitalization equities have historically had greater volatility than large capitalization equities. The Strategy ascribes to a disciplined bottom-up fundamental selection process with an emphasis given to the cash flow generating capabilities of a company. The Strategy’s objective is to outperform the Russell 2000 Value Index which is used as our benchmark. Eligible portfolios must be managed for a full calendar month prior to inclusion in the Small Cap Value composite. Composite dispersion is measured using an asset weighted standard deviation of gross returns of the portfolios included for the entire year. Returns and asset values are stated in US dollars.
The Russell 2000 Value Index measures the performance of the Russell 2000 companies with lower price-to-book ratios and lower forecasted growth values. For comparison purposes, the Index is fully invested, which includes the reinvestment of income. The return for the Index does not include any transaction costs, management fees or other costs. It is not possible to invest directly in the Index.
Sources: Pacific Ridge; FactSet Research Systems (“FactSet”); and Russell Investment Group (“Russell”) who is the source and owner of the Russell Index data.
Returns for the Small Cap Value composite are time-weighted and presented gross and net of management fees and other expenses and includes realized and unrealized gains and losses, cash and cash equivalents and related interest income, and accrued based dividends. Net returns are calculated by deducting the highest annual management fee of 1.00% from the quarterly gross composite return. Performance-based fees are available upon request. All returns are calculated after the deduction of the actual trading expenses incurred during the period.
The fee schedule for separately managed accounts is a flat rate of 1.00%.
The portfolio characteristics, sector weightings and attribution analysis for the Small Cap Value composite are based on a representative account within the Strategy. The representative account statistics are shown as supplemental information. The Firm maintains a complete list of contributors and detractors to portfolio return as well as a complete list and description of composites and pooled funds, policies for valuing portfolios, calculating performance, and preparing GIPS Reports, all of which are available upon request by contacting Peter Trumbo, Chief Operating Officer/Chief Compliance Officer at (503) 886-8972 or Peter.Trumbo@PacificRidgeCapital.com.
GIPS is a registered trademark of CFA Institute. CFA Institute does not endorse or promote this organization, nor does it warrant the accuracy or quality of the content contained herein.
Top and Bottom Performing Securities represent those security holdings that had the largest positive and negative total contribution to the portfolio return for the quarter. Top and Bottom Economic Sectors represent those sectors that had the largest positive and negative total contribution to the portfolio return. The holdings identified do not represent all the securities purchased, sold or recommended to clients.
In order to maintain consistency when comparing the Small Cap Value strategy to the Russell benchmark, the Firm utilizes FactSet’s outlier methodology calculations which provide a comparable portfolio characteristic calculation methodology as Russell applies to its indices.
The information provided should not be considered a recommendation to purchase or sell any particular security. There is no assurance that any securities discussed herein will remain in the Strategy at the time you receive this report or that securities sold have not been repurchased. It should not be assumed that any of the holdings discussed herein were or will be profitable or that the investment recommendations or decisions we make in the future will be profitable or will equal the investment performance of the securities discussed herein. Past performance is no guarantee of future results.
Although the statements of fact and data in this report have been obtained from, and are based upon, sources that the Firm believes to be reliable, we do not guarantee their accuracy, and any such information may be incomplete or condensed. All opinions included in this report constitute the Firm’s judgment as of the date of this report and are subject to change without notice. This report is for informational purposes only and is not intended as an offer or solicitation with respect to the purchase or sale of any security.
| Investment Team | Other Professionals | |||
| Dominic Marshall, CFA® | Senior Portfolio Manager | Peter Trumbo | Chief Operating Officer/Chief Compliance Officer | |
| Mark Cooper, CFA® | Portfolio Manager | Mike McDougall | Senior Trader | |
| Ryan Curdy, CFA® | Portfolio Manager | Manisha Thakkar, CFA® | Director of Business Development | |
| Justin McKillip, CFA® | Senior Analyst | Veronica Orazio | Operations Assistant | |
| Adam Wilkie, CFA® | Senior Analyst | |||
| Laura Moon | Analyst | |||
CFA® is a trademark owned by the CFA Institute. |
||||