

Performance Review
The Pacific Ridge Capital Partners Micro Cap Value strategy (the “Strategy”) returned -5.6%* (-5.9* net of fees) during the second quarter ended June 30, 2024, underperforming the Russell Microcap® Value Index (the “Index”) return of -5.1%.

*Preliminary results. For additional performance information, see the related GIPS® Report below.
The Strategy’s portfolio characteristics can be significantly different from the Index because we primarily invest in smaller, undervalued stocks and adopt a sector-agnostic approach. You can see these distinctions in the charts below.
Size Analysis
During the quarter, the Strategy faced a moderate size headwind where larger companies in the Index outperformed smaller ones. Stocks with a market capitalization above the $275 million Index median saw a return of -4.6%, versus -8.4% return for stocks with a market capitalization below the breakpoint level. The Index had 84.1% of its weight above the median market capitalization level, while the Strategy had a comparatively lower 49.9% weight.

**The size breakpoint in the chart is based on the Index’s median market capitalization at the beginning of the period.
Style Analysis
The Strategy benefited from a moderate style bias tailwind in unprofitable companies (stocks with a PE ratio less than 0x) that posted the worst return in the Index of -11.9%. The Index had a 29.7% weight in unprofitable companies versus the Strategy at 12.7%. A further modest tailwind came from profitable companies with relatively low valuations (PE ratio below 15x) being down just 1.9%, where the Strategy’s weighting was 49.8% versus the Index weighting of 37.1%.

*P/E ratios are based on analyst estimates for the current fiscal year, including both completed and estimated quarterly results. Companies that have no earnings estimates have been excluded, and thus the bars may not add up to 100%.
Sector Analysis
The top two positive drivers of the Strategy’s performance were the Health Care and Financials sectors. The lack of exposure to the Health Care sector provided a moderate tailwind, while the slight overweight position in the Financials sector, the second-best performing sector in the Index, modestly contributed. The two sectors that most negatively impacted the Strategy’s performance were Industrials and Consumer Discretionary. Despite a very slight positive allocation effect from overweighting the Industrials sector and a slight negative allocation effect from overweighting the Consumer Discretionary sector, poor stock selection in both sectors was a moderate detractor.

Portfolio Characteristics (as of 6/30/24)

Top Contributors
Top Detractors

Top Contributors
Lakeland Industries (“LAKE”) designs, manufactures, and sells safety garments and accessories to petrochemical companies, municipalities, and laboratories. The company has increased its gross margin by gaining market share in higher-value products and making beneficial acquisitions that introduced new sales channels for legacy products. Following a rise in its share price last quarter, we reduced our position in the Strategy. However, we still believe the shares are undervalued and continue to hold the security.
Northeast Bank (“NBN”) is a community bank and specialty finance lender. Management has significant expertise investing in distressed commercial real estate (“CRE”) assets. Despite concerns over higher interest rates negatively impacting CRE, the stock has been a steady performer over the last several years and is up 500% from its pandemic lows. The bank reported another strong quarter of earnings ahead of expectations, quelling worries over the potential for stress in their CRE loan book.
Metropolitan Bank (“MCB”) is a community bank based in New York, NY that has experienced volatile stock performance in recent years. Last spring, several bank runs and the collapse of a geographic competitor’s share price impacted MCB’s stock. However, following a strong earnings report, the stock rebounded from recent lows. Despite solid performance during the quarter, MCB continues to trade at a significantly discounted valuation.
Lincoln Educational Services (“LINC”) is an education company that operates vocational schools at locations across the United States. Management has executed several initiatives to drive profitability higher, including opening new schools and expanding existing programs to additional campuses. The stock has performed very well over the past year as evidence of these initiatives has materialized. The company should benefit from an additional tailwind to enrollment should the unemployment rate continue to move higher in the coming year.
Miller Industries (“MLR”), the largest tow truck manufacturer in the U.S., posted another strong quarter with better-than-expected revenue growth and increased margins. The company has benefited from improved post-COVID demand and resolution of supply chain shortages. Over the past five years, MLR has invested in manufacturing efficiencies and sales processes. Despite trimming our position after the recent stock rise, we still view the shares as attractively priced and maintain a relatively higher weighting in the Strategy.
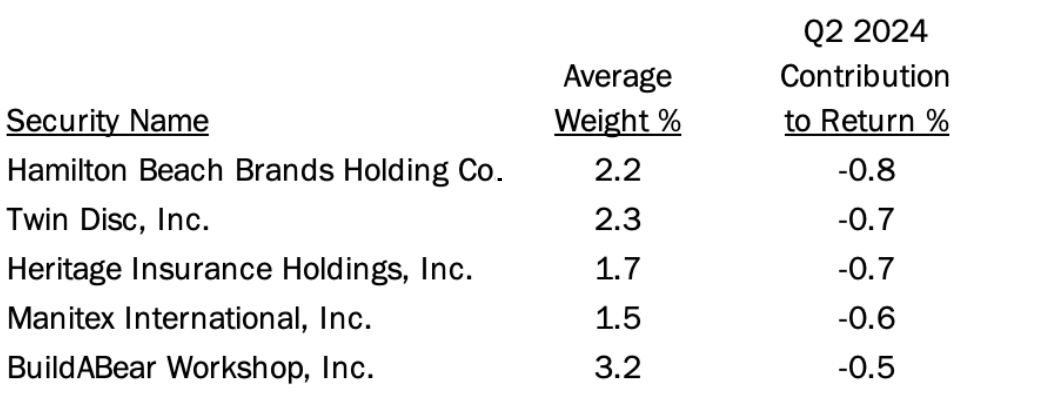
Top Detractors
Hamilton Beach Brands (“HBB”) is a marketer of commercial and residential kitchen appliances. Despite stellar performance over the past two years, its shares dropped by 29% this quarter. Although management reported higher margins last year, sales in the consumer product segment have slightly declined, with no improvement expected soon. Additionally, share price volatility is likely to persist through the holiday selling season and into next year. That said, HBB is conservatively leveraged, limiting financial risk, and continues to pay an attractive dividend. For these reasons, we continue to hold the shares in the Strategy.
Twin Disc (“TWIN”) is a manufacturer of power transmission equipment. TWIN experienced flat revenues in its latest quarter following several periods of double-digit growth. A leaner cost structure enabled the company to post solid earnings despite higher investment to drive its hybrid electric transmission strategy. Strong free cash flow has led to net cash on the balance sheet, supporting a rare acquisition that broadens its geographic reach and adds electrification capabilities. The transition of off-highway equipment to hybrid electric transmissions is in the early innings and represents a major opportunity to drive future earnings.
Heritage Insurance (“HRTG”), a property and casualty insurer primarily based in Tampa, FL, saw its stock decline after nearly doubling in the first quarter. The Florida insurance market is currently in transition, as recent legislation appears successful in reducing rampant fraud. The stock is expected to remain volatile until investors gain a clearer understanding of normalized earnings.
Manitex International (“MNTX”), a provider of highly specialized lifting and hauling solutions to niche end markets, reported strong earnings in its latest quarter that were well above expectations. While high interest rates and inflationary pressures have led to some recent softness in the market, the powerful spending drivers in infrastructure, power generation, and government works projects should provide stable demand for lifting equipment. In addition, the company is on track to expand its knuckle boom crane with several distributors in North America. This is a key part of MNTX’s long-term growth strategy.
BuildABear Workshop (“BBW”) is a specialty retailer that offers an interactive “make your own stuffed animals” experience. Fiscal 1Q (thru April) results were slightly below expectations, due to consumer weakness and inflation in labor and other operating expenses. Management maintained full-year guidance, and with the 15% decline in shares, the valuation remains attractive. While the environment is likely to be challenging, BBW’s growth and profitability should be aided by 50+ new locations opening this year, most of which will be non-mall and low-capital partner or franchised units.
Market Outlook
Mixed economic indicators in areas such as consumer spending and business investment have staved off recession. Investor sentiment has been optimistic, driving up U.S. stock market indices. The strong performance of the Magnificent 7 has led to record levels for large-cap benchmarks, particularly the S&P 500 and Nasdaq. This optimism has widened the divergence in performance between large-cap and small-cap stocks, with investors favoring large caps. In contrast, small-cap stocks have struggled because of higher interest rates and greater concentrations in the Financials sector, driven by concerns about defaults in commercial real estate loans.
In May, the core PCE Index, which excludes food and energy, decreased by 0.2% to 2.6%. This decline brings the Index closer to the Federal Reserve’s year-end target, though it still exceeds the long-term goal of 2.0%. Discretionary components have shown minimal price increases. However, non-discretionary categories such as healthcare and insurance costs remain elevated, resulting in sticky inflation. The June nonfarm payrolls report indicated a slight decline to 206,000 jobs added, down from the revised 218,000 reported for May. Additionally, the unemployment rate in June increased to 4.1%, the first time it has reached this level since November 2021. Wage growth has slowed to 3.9%, the lowest rate in three years.
The ISM Manufacturing PMI contracted to 48.5%, down 0.2% from May, while the ISM Services PMI fell to 48.8%, a significant drop from May’s figure of 53.8%. These indicators suggest a broader economic slowdown in June, with both major sectors of the economy contracting. The final GDP for Q1 2024 increased at an annualized rate of 1.4%, while the Atlanta Federal Reserve forecasts 1.5% growth in Q2 2024.
The economy is slowing, unemployment is gradually rising, and inflation is coming off its highs. The stock market has a greater chance of broadening out once interest rates fall, recognizing the potential of undervalued small-cap stocks that typically perform better in a declining interest rate environment. This has happened previously after the dot com bubble burst and the Fed cut interest rates from 6.5% in 2000 to 1% in 2003, after the 2008 Financial Crisis when the Fed cut interest rates from 5.25% in 2007 to near zero, and during COVID when rates were similarly slashed from 2.25%. The result was strong Russell 2000 performance and small-caps outperforming large-caps.
PRCP GIPS Report

*2021 Composite Dispersion excluding one account with a significant cash flow was 0.2%.
Disclosures
Pacific Ridge Capital Partners, LLC (“Pacific Ridge”, “PRCP”, or “the Firm”) is a 100% employee-owned investment advisor registered with the Securities and Exchange Commission under the Investment Advisors Act of 1940. The Firm was established in June 2010, and has one office located in Lake Oswego, Oregon. Pacific Ridge claims compliance with the Global Investment Performance Standards (GIPS®) and has prepared and presented this report in compliance with the GIPS standards. Pacific Ridge has been independently verified for the periods June 10, 2010 through March 31, 2024. A firm that claims compliance with the GIPS standards must establish policies and procedures for complying with all the applicable requirements of the GIPS standards. Verification provides assurance on whether the firm’s policies and procedures related to composite and pooled fund maintenance, as well as the calculation, presentation, and distribution of performance, have been designed in compliance with the GIPS standards and have been implemented on a firm-wide basis. The Micro Cap Value composite has had a performance examination for the periods June 10, 2010 through March 31, 2024. The verification and performance examination reports are available upon request.
The Micro Cap Value composite was created on June 10, 2010 and incepted on April 1, 2007. Performance from 2007 to 2010 is from portfolios managed at another entity. The Micro Cap Value composite comprises fully discretionary portfolios managed by the Firm invested primarily in a concentrated equity portfolio of smaller companies with market capitalizations similar to those found in the Russell Microcap® Index. Smaller capitalization equities have historically had greater volatility than large capitalization equities. The Strategy ascribes to a disciplined bottom-up fundamental selection process with an emphasis given to the cash flow generating capabilities of a company. The Strategy’s objective is to outperform the Russell Microcap Value Index which is used as our benchmark. Eligible portfolios must be managed for a full calendar month prior to inclusion in the Micro Cap Value composite. Composite dispersion is measured using an asset weighted standard deviation of gross returns of the portfolios included for the entire year. Returns and asset values are stated in US dollars.
The Russell Microcap Value Index measures the performance of the microcap segment of the U.S. equity market. For comparison purposes, the Index is fully invested, which includes the reinvestment of income. The return for the Index does not include any transaction costs, management fees or other costs. It is not possible to invest directly in the Index.
Sources: Pacific Ridge; FactSet Research Systems (“FactSet”); and Russell Investment Group (“Russell”) who is the source and owner of the Russell Index data.
Returns for the Micro Cap Value composite are time-weighted and presented gross and net of management fees and other expenses and includes realized and unrealized gains and losses, cash and cash equivalents and related interest income, and accrued based dividends. Net returns are calculated by deducting the highest annual management fee of 1.50% from the quarterly gross composite return. Performance-based fees are available upon request. All returns are calculated after the deduction of the actual transaction costs incurred during the period.
The fee schedule for separately managed accounts is a flat rate of 1.50%.
The portfolio characteristics, sector weightings and attribution analysis for the Micro Cap Value composite are based on a representative account within the Strategy. The representative account statistics are shown as supplemental information. The Firm maintains a complete list of contributors and detractors to portfolio return as well as a complete list and description of composites and pooled funds, policies for valuing portfolios, calculating performance, and preparing GIPS Reports, all of which are available upon request by contacting Peter Trumbo, Chief Operating Officer/Chief Compliance Officer at (503) 886-8972 or Peter.Trumbo@PacificRidgeCapital.com.
GIPS is a registered trademark of CFA Institute. CFA Institute does not endorse or promote this organization, nor does it warrant the accuracy or quality of the content contained herein.
Top and Bottom Performing Securities represent those security holdings that had the largest positive and negative total contribution to the portfolio return for the quarter. Top and Bottom Economic Sectors represent those sectors that had the largest positive and negative total contribution to the portfolio return. The holdings identified do not represent all the securities purchased, sold or recommended to clients.
In order to maintain consistency when comparing the Micro Cap Value strategy to the Russell benchmark, the Firm utilizes FactSet’s outlier methodology calculations which provide a comparable portfolio characteristic calculation methodology as Russell applies to its indices.
The information provided should not be considered a recommendation to purchase or sell any particular security. There is no assurance that any securities discussed herein will remain in the Strategy at the time you receive this report or that securities sold have not been repurchased. It should not be assumed that any of the holdings discussed herein were or will be profitable or that the investment recommendations or decisions we make in the future will be profitable or will equal the investment performance of the securities discussed herein. Past performance is no guarantee of future results.
Although the statements of fact and data in this report have been obtained from, and are based upon, sources that the Firm believes to be reliable, we do not guarantee their accuracy, and any such information may be incomplete or condensed. All opinions included in this report constitute the Firm’s judgment as of the date of this report and are subject to change without notice. This report is for informational purposes only and is not intended as an offer or solicitation with respect to the purchase or sale of any security.
| Investment Team | Other Professionals | |||
| Dominic Marshall, CFA® | Senior Portfolio Manager | Peter Trumbo | Chief Operating Officer/Chief Compliance Officer | |
| Mark Cooper, CFA® | Portfolio Manager | Mike McDougall | Senior Trader | |
| Ryan Curdy, CFA® | Portfolio Manager | Manisha Thakkar, CFA® | Director of Business Development | |
| Justin McKillip, CFA® | Senior Analyst | Veronica Orazio | Operations Assistant | |
| Adam Wilkie, CFA® | Senior Analyst | |||
| Laura Moon | Analyst | |||
CFA® is a trademark owned by the CFA Institute. |
||||