

Q2’21 Micro Cap Value Strategy
Market Commentary
The economic trajectory over the past year has been unlike anything we have ever seen. A record decline in economic activity followed by a debt-fueled stimulus reduced the amount of time it will take to resume pre-pandemic trend growth. Since society has not fully returned to normal, we are still waiting to see how this transition process plays itself out.
As normal economic activity steadily resumes, we should see significant changes on the employment front as jobless claims decline and supplemental unemployment insurance tapers off. Several government programs meant to support those most adversely impacted by the pandemic will also phase out. These include student loan deferrals, eviction and foreclosure moratoriums and assistance through the Paycheck Protection Program (PPP). With so many moving parts, forecasting economic growth for the next twelve to eighteen months remains challenging.
Amid this backdrop, the financial media is giving a lot of attention to the prospect of inflation. Figures for the Consumer Price Index (CPI) and Personal Consumption Expenditures (PCE) are grabbing headlines, showing a year-over-year increase north of 3%, well above the Federal Reserve target of 2%. Month-over-month changes have been a little noisier, with CPI spiking as high as 11%. However, alternative measures such as the Trimmed Mean PCE are significantly more muted, with year-over-year inflation in line with the mean of the past twenty years.
Sustained inflation increases the likelihood that the Fed will be forced to increase interest rates sooner than anticipated, thereby slowing down the economic recovery. Though some commentators and market participants ring alarm bells about this possibility, others suggest that higher inflation levels are temporary. Several key indicators that provide insight into market expectations around future inflation validate this latter view, suggesting fears of runaway inflation are overblown. For example, the implied inflation in Treasury Inflation Protected Securities (TIPS) declined to 2.33% after peaking at 2.54% in mid-May. Similarly, yields on ten-year Treasury Securities declined by the same amount, reflecting a fall in implied inflation expectations, rather than a decrease in real rates.
As the saying goes, to understand the future, you need to understand the past. Across the economy, unprecedented stimulus created a tremendous amount of liquidity. The resultant increased demand for goods, combined with pandemic supply chain disruptions, led to shortages in several industries, most notably semiconductors, lumber and low-wage labor. This resulted in several knock-on effects where a lack of supply became distributed across a broad range of products and services such as new cars, appliances, gaming consoles, housing and retail staffing. In microeconomics, we learned that when supply is low, prices rise and equilibrium is only pushed back down when supply improves, demand decreases or consumers choose lower-cost substitutes.
Another unappreciated factor that drove inflationary pressure for durable goods last quarter was the inability for consumers to spend money on services and entertainment because of government-mandated lockdowns. As these lockdowns ease, we anticipate a shift in spending back to services. This should reduce demand for durable goods and ease inflationary pressure.
At some point, supply chains will recover from prior shutdowns and production will accelerate to take advantage of above-average profit margins. Combined with a decline in government stimulus and excess liquidity, we believe that concern over inflation will moderate.
Investors are understandably relieved about the speed of the economic recovery. A premature end to accommodative monetary policy would serve as an unwelcome headwind to financial markets. At this time, we are more concerned about the economic and societal adjustments that will occur as various stimulus and assistance programs are phased out. Navigating our way out of a slowly fading pandemic may prove more challenging to policymakers than most currently expect.

*Preliminary results. For additional performance information, see the related GIPS® Report at the bottom of the page.
Strategy Review
The Pacific Ridge Capital Partners’ Micro Cap Value strategy returned 3.9%* during the second quarter of 2021, underperforming the 4.8% return of the Russell Microcap® Value Index (“Index”). Over the trailing one-, three- and five-year periods, the strategy returned 73.2%*, 6.7%* and 16.7%* (annualized), respectively, compared to the Index returns of 83.6%, 11.6% and 17.1%. Since inception on April 1, 2007, the strategy has returned 11.5%* annually versus 7.6% for the Index.
*Preliminary results. For additional performance information, see the related GIPS® Report at the bottom of the page.
Top Contributors and Detractors to Return for Second Quarter 2021**
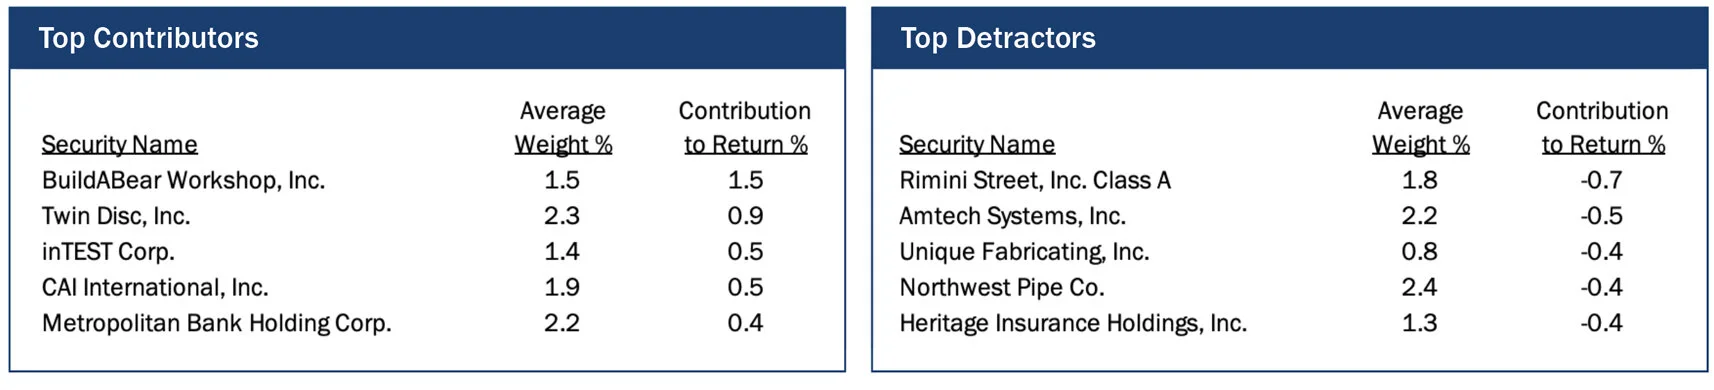
Top Contributors
Build-A-Bear Workshop (“BBW”) is a retailer of customized plush toys. The company reported blowout earnings for the first quarter that greatly exceeded analyst expectations. While year-over-year comparisons were difficult, revenues increased nearly 10% relative to 2019 levels and forward looking projections for EBITDA are the highest in recent history. The company continues to form partnerships with key brands (e.g., Harry Potter, Animal Crossing, Pokemon) that should help sustain revenue growth going forward.
Twin Disc (“TWIN”) is a manufacturer of power transmission equipment. The stock strongly rebounded this year after slowly trending downward since 2018. Management sounds much more optimistic about the trajectory of activity in their key end markets, specifically oil and gas. With a resumption in normal economic activity and travel, demand for TWIN’s products should steadily improve. New company offerings in the marine segment may also provide an extra leg of growth moving forward.
inTest (“INTT”) is a manufacturer of thermal management products for the semiconductor industry. The stock has skyrocketed over the past year because of shortages in the semiconductor industry that led to increased demand for their products. Booking and backlog figures grew at 43% and 49% quarter-over-quarter. To lessen the volatility of their results, management is attempting to diversify beyond the semiconductor industry.
CAI International (“CAI”) is a lessor of cargo shipping containers. The stock traded sideways for much of the quarter prior to announcing in mid-June their pending acquisition by Mitsubishi HC Capital. The container market has seen significant price increases thanks to high demand of consumer goods stemming from mandated lockdowns and government stimulus. As a result of the pending acquisition, we exited our position during the quarter.
Metropolitan Bank Holding (“MCB”), a Manhattan-based community bank, continued to rally during the quarter as credit concerns related to New York City and their health care portfolio dissipated. Sell-side estimates have been steadily revised higher as the company continues to play up their fintech capabilities. MCB is also catering to other online-only banks, helping these customers with their backend infrastructure. This new business generates a nice stream of fee income and should reward MCB with a better earnings multiple over time.
Top Detractors
Rimini Street (“RMNI”) is a provider of support and services for enterprise software. The company reported first quarter revenues that were slightly below expectations and adjusted EBITDA notably downward compared to the fourth quarter. Reigniting growth on the domestic front is a key metric that analysts are watching going forward. Using cash on hand and free cash flow, the company will look to retire $140 million of costly preferred debt that is now callable.
Amtech Systems (“ASYS”), a manufacturer of semiconductor capital equipment, traded down through most of the quarter following a significant rally over the past year. The company is seeing a ramp in demand, thanks to the lack of semiconductor availability. While earnings for the first quarter were a slight miss, bookings suggest a near-term revenue increase. A small acquisition made during the quarter should provide a modest tailwind to margins.
Unique Fabricating (“UFAB”) is a leading component supplier to the North American auto and industrial end markets. The stock sold off during the quarter following disappointing earnings, a need to restate prior quarterly results and a going concern opinion centered on the company’s ability to service their debt. With a resumption in automotive and appliance production, management appears confident that they will generate sufficient cash flow to regain compliance with their financial covenants.
Northwest Pipe (“NWPX”), a manufacturer for engineered steel pipe systems, gave back some gains during the quarter following a strong rally over the prior year. First quarter results were impacted by a variety of factors, including weather, steel shortages and delays in bidding. We see these issues as transitory and anticipate a pick-up in business in the second half of the year.
Heritage Insurance (“HRTG”) is a provider of property and casualty insurance. The stock has struggled over the past year due to a high frequency of weather events in their core markets. Though the impact of these events on HRTG’s financials is under control, management has blamed their issues on “death by a thousand cuts.” The company is culling the least profitable policies from their book of business and implementing double-digit premium increases.
**Past performance does not guarantee future results. The holdings identified do not represent all the securities purchased, sold or recommended to clients. Top contributors and detractors to return represent those securities that had the largest positive and negative total contribution to the overall portfolio return for the quarter. A complete list of contributors to portfolio return can be obtained by contacting Peter Trumbo, Chief Compliance Officer, at 503-886-8972 or by email at Peter.Trumbo@PacificRidgeCapital.com. For additional information, see the related GIPS® Report on the last page.
Market Capitalization Analysis
There was a moderate size bias tailwind during the quarter, as smaller companies in the Index outperformed larger companies. Those with a market cap below $400 million in the Index returned 6.7%, versus a gain of 4.2% for firms with a market cap above $400 million. The strategy had 66.3% of its holdings in companies with a market cap below $400 million, compared to 25.1% for the Index.

Style Analysis
There was a slight value-bias headwind during the quarter, as stocks with higher PEs outperformed those with lower PEs. Those with a PE ratio greater than 15x returned 5.3% versus 4.9% for those companies with a PE below 15x. The strategy had 40.9% of its holdings in companies with a PE greater than 15x compared to 34.3% for the Index. The performance of unprofitable companies in the Index created a slight tailwind, as those stocks returned 4.7%, versus a gain of 5.0% for firms that were profitable. The strategy had 7.8% of its holdings in unprofitable companies, compared to 22.1% for the Index.

Economic Sector Analysis
The strategy’s performance in Financials contributed approximately 70 basis points of excess return compared to the Index. However, performance in Information Technology detracted approximately 170 basis points versus the Index. After a strong headwind to performance during the first quarter, GameStop (“GME”) detracted approximately 20 basis points versus the Index. The strategy’s lack of exposure to the Communication Services, Health Care and Utilities sectors had no significant impact on relative performance.

Market Outlook
We continue to have a modest growth outlook for the US economy as society slowly returns to normal. The recovery carried through 1Q21 with GDP growth of 6.4% as business re-openings and additional fiscal stimulus helped drive increases in corporate profits and personal consumption. Sentiment amongst purchasing managers remains positive with the June 2021 US manufacturing PMI reading of 60.6, the thirteenth consecutive month of expansion. New Orders and Production components remain strong while inventories appear to be building slightly. However, a challenged labor market and supply chain disruptions could limit economic growth in the near-term.
Portfolio Characteristics and Top Ten Holdings (as of 6/30/21)

As always, we continue to search for companies that demonstrate an ability to earn a fair return on capital. We welcome any questions or comments you may have and thank you for your continued support.
Sincerely,
Pacific Ridge Capital Partners
Investment Team Additional Professionals
Mark Cooper, CFA® Co-Senior Portfolio Manager Peter Trumbo Chief Operating Officer/Compliance Officer
Dominic Marshall, CFA® Co-Senior Portfolio Manager Mike McDougall Senior Trader
Ryan Curdy, CFA® Portfolio Manager Veronica Orazio Operations Assistant
Justin McKillip, CFA® Senior Analyst
Adam Boyce, CFA® Senior Analyst
Regulatory Disclosures
The contributors and detractors to return, market capitalization weightings and total effect, economic sector weightings and total effect, portfolio characteristics, and top ten holdings for the Micro Cap Value Composite are based on a representative account within the strategy. The representative account statistics are shown as supplemental information and complement the composite's GIPS® Report as provided on the last page.
The Russell Microcap® Value Index measures the performance of the microcap segment of the U.S. equity market. For comparison purposes, the index is fully invested, which includes the reinvestment of income. The return for the index does not include any transaction costs, management fees or other costs.
In order to maintain consistency when comparing the Micro Cap Value strategy to the Russell benchmark, the Firm utilizes FactSet’s outlier methodology calculations which provide a comparable portfolio characteristic calculation methodology as Russell applies to its indices.
The information provided should not be considered a recommendation to purchase or sell any particular security. There is no assurance that any securities discussed herein will remain in our strategy at the time you receive this report or that securities sold have not been repurchased. It should not be assumed that any of the holdings discussed herein were or will be profitable or that the investment recommendations or decisions we make in the future will be profitable or will equal the investment performance of the securities discussed herein. Past performance is no guarantee of future results.
Although the statements of fact and data in this report have been obtained from, and are based upon, sources that the Firm believes to be reliable, we do not guarantee their accuracy, and any such information may be incomplete or condensed. All opinions included in this report constitute the Firm’s judgment as of the date of this report and are subject to change without notice. This report is for informational purposes only and is not intended as an offer or solicitation with respect to the purchase or sale of any security.
PRCP GIPS Report

Disclosures
Pacific Ridge Capital Partners, LLC (“Pacific Ridge”, “PRCP”, or “the Firm”) is a 100% employee owned investment advisor registered with the Securities and Exchange Commission under the Investment Advisors Act of 1940. The Firm was established in June 2010, and has one office located in Lake Oswego, Oregon. Pacific Ridge claims compliance with the Global Investment Performance Standards (GIPS®) and has prepared and presented this report in compliance with the GIPS standards. Pacific Ridge has been independently verified for the periods June 10, 2010 through March 31, 2021. A firm that claims compliance with the GIPS standards must establish policies and procedures for complying with all the applicable requirements of the GIPS standards. Verification provides assurance on whether the firm’s policies and procedures related to composite and pooled fund maintenance, as well as the calculation, presentation, and distribution of performance, have been designed in compliance with the GIPS standards and have been implemented on a firm-wide basis. The Micro Cap Value Composite has had a performance examination for the periods June 10, 2010 through March 31, 2021. The verification and performance examination reports are available upon request.
The Micro Cap Value composite was created on June 10, 2010 and incepted on April 1, 2007. The Micro Cap Value composite comprises fully discretionary portfolios managed by the Firm invested primarily in a concentrated equity portfolio of smaller companies with market capitalizations similar to those found in the Russell Microcap® Index. The strategy ascribes to a disciplined bottom-up fundamental selection process with an emphasis given to the cash flow generating capabilities of a company. The strategy’s objective is to outperform the Russell Microcap® Value Index which is used as our benchmark. Eligible portfolios must be managed for a full calendar month prior to inclusion in the Micro Cap Value composite. Prior to June 10, 2010 the performance represents the track record established by the Portfolio Management Team while affiliated with prior firms. The portability of the prior track record has been reviewed by Ashland Partners & Company LLP. Composite dispersion is measured using an asset weighted standard deviation of gross returns of the portfolios included for the entire year. Returns and asset values are stated in US dollars.
The Russell Microcap® Value Index measures the performance of the microcap segment of the U.S. equity market. For comparison purposes, the index is fully invested, which includes the reinvestment of income. The return for the index does not include any transaction costs, management fees or other costs.
Sources: Pacific Ridge; FactSet Research Systems (“FactSet”); and Russell Investment Group (“Russell”) who is the source and owner of the Russell Index data.
Returns for the Micro Cap Value composite are presented gross and net of management fees and other expenses and includes realized and unrealized gains and losses, cash and cash equivalents and related interest income, and accrued based dividends. Net returns are calculated by deducting the highest annual management fee of 1.50% from the quarterly gross composite return. Performance-based fees are available upon request. All returns are calculated after the deduction of the actual transaction costs incurred during the period. The management fee schedule and total expense ratio for the Micro Cap Value Fund, which is included in the composite, are 1.50% on all assets and 1.68%, respectively, as of the most recent audit. Total fees for the fund may not exceed 1.75% annually.
The fee schedule for separately managed accounts is a flat rate of 1.50%.
The portfolio characteristics, sector weightings and attribution analysis for the Micro Cap Value composite are based on a representative account within the strategy. The representative account statistics are shown as supplemental information. The Firm maintains a complete list and description of composites and pooled funds, policies for valuing portfolios, calculating performance, and preparing GIPS Reports which are available upon request by contacting Peter Trumbo, Chief Compliance Officer at (503) 886-8972 or Peter.Trumbo@PacificRidgeCapital.com.
GIPS® is a registered trademark of CFA Institute. CFA Institute does not endorse or promote this organization, nor does it warrant the accuracy or quality of the content contained herein.
Top 5 and Bottom 5 Performing Securities represent those security holdings that had the largest positive and negative total contribution to the portfolio return. Top 3 and Bottom 3 Economic Sectors represent those sectors that had the largest positive and negative total contribution to the portfolio return.
In order to maintain consistency when comparing the Micro Cap Value strategy to the Russell benchmark, the Firm utilizes FactSet’s outlier methodology calculations which provide a comparable portfolio characteristic calculation methodology as Russell applies to its indices.
The information provided should not be considered a recommendation to purchase or sell any particular security. There is no assurance that any securities discussed herein will remain in our strategy at the time you receive this report or that securities sold have not been repurchased. It should not be assumed that any of the holdings discussed herein were or will be profitable or that the investment recommendations or decisions we make in the future will be profitable or will equal the investment performance of the securities discussed herein. Past performance is no guarantee of future results.
Although the statements of fact and data in this report have been obtained from, and are based upon, sources that the Firm believes to be reliable, we do not guarantee their accuracy, and any such information may be incomplete or condensed. All opinions included in this report constitute the Firm’s judgment as of the date of this report and are subject to change without notice. This report is for informational purposes only and is not intended as an offer or solicitation with respect to the purchase or sale of any security.