

Second Quarter, 2019 Micro Cap Value Strategy
Market Commentary
We frequently mention that, as long-term investors, we avoid the prevailing near-term sentiment. The activity around interest rates and the economic outlook over the past year validates this perspective. Equities have been particularly volatile with a sharp sell-off in the fourth quarter followed by an impressive rally over the first half of 2019. When the economy seems to be late in the cycle, capital markets can often experience random panic attacks over short-term headwinds. Weak economic data, which leads the Fed to consider interest rate cuts, tends to heighten these anxieties. With a wide variety of data points, conflicting news accounts and partisan political campaigns, it can be difficult to get a true sense of the status of our economy.
To filter through the noise, we track a handful of select data points that are a mix of concurrent and leading indicators. These generate a proprietary score that we have back-tested over several decades. In the past, this score has proven to be a reliable recession indicator with the absence of any false positives. We believe the model has been especially helpful as an unbiased measure late in the business cycle when the economy begins to slow and the Fed begins to cut rates, much like the environment we find ourselves in now. Our proprietary score also helps insulate us from being unduly influenced by the perma-bulls or perma-bears that seem to dominate much of the financial media.
It has been noted many times that the “state of the economy” is not synonymous with “the state of the market,” and vice-versa. Therefore, just as no two recessions are identical, the market and the economy do not necessarily move in sync, although they definitely march to a similar beat. We believe that keeping a close eye on our score enhances our decision making process when forecasting revenue and earnings growth rates for our holdings and, at the overall portfolio management level, as we consider allocations toward economically-sensitive sectors. The recent brief yield curve inversion and the likelihood of rate cuts this year have already generated initial recession calls. As we see it, we still need to experience a fair amount of deterioration in our key metrics before we declare that a downturn is imminent.
Strategy Review
The Pacific Ridge Capital Partners’ Micro Cap Value strategy rose 5.4%* during the second quarter of 2019, outperforming the 1.4% return of the Russell Microcap® Value Index (“Index”). Over the trailing one-, three- and five and ten-year periods, the strategy returned -11.0%*, 16.7%*, 11.7%* and 18.3%* (annualized), respectively, compared to the Index returns of -10.9%, 12.2%, 6.3% and 13.0%. Since inception on April 1, 2007, the strategy returned 10.7%* annually versus 5.0% for the Index.

Top Contributors and Detractors to Return**

Top Contributors
DMC Global (“BOOM”), a manufacturer of oil field service equipment, rallied sharply in April as management raised revenue expectations for the first quarter. The company has benefited from strong performance in their DynaEnergetics segment, which has been partially driven by a recovery in crude oil prices. BOOM continues to gain market share with its factory-assembled integrated perforating systems that provide cost savings and improved safety for operators.
ASV Holdings (“ASV”), a manufacturer of compact track loaders and skid steer loaders, announced near the end of the quarter that they agreed to be acquired by Yanmar Holdings, a Japan-based industrial equipment manufacturer. The stock had struggled over the past year as the company dealt with supply chain constraints and material cost headwinds. The acquisition came with a substantial premium, reflecting Yanmar Holdings’ optimism that they can return sales and profitability to the levels ASV experienced a decade ago.
Ultra Clean Holdings (“UCTT”) is a developer and manufacturer of critical subsystems in the semiconductor capital equipment industry. The stock continued its recovery off the bottom during the quarter as the industry is in the midst of a trough in capital spending.
Northeast Bank (“NBN”) is a community bank operating in southwest Maine. NBN saw its stock price spike 35% on the last trade of the quarter for two reasons: (1) a lack of liquidity, and (2) a large buyer adjusting their position due to the Russell Index rebalancing. Much of the gain was subsequently given back on the first trading day of the third quarter.
P.A.M. Transportation Services (“PTSI”) is a dry van truckload carrier. PTSI has benefited in the last few years from strong industry demand that has led to double-digit rate increases. To meet demand, management has grown its fleet by 14% and 17% the past two quarters, respectively (YOY). Despite a thin float, the company conducted another Dutch tender during the quarter that provided additional support to the stock price.
Top Detractors
ZAGG (“ZAGG”) is a provider of mobile phone battery packs and accessories. The stock has been weak over the past year as smartphone demand has declined given that the industry is between upgrade cycles. There is also concern that demand for ZAGG’s batteries will further soften now that Apple has entered that business. Several recent acquisitions are expected to offset this weakness and drive a better second half of the year.
Zovio (“ZVO”) is a for-profit education company that operates Ashford University. Management is looking to spin out the university as a non-profit and will operate as an online program manager, providing services to Ashford and other online schools. The stock sold off in the quarter as the regulatory approval for the spin-out was delayed and enrollment trends were below expectations.
Manitex (“MNTX”) is a provider of highly specialized lifting and hauling solutions to niche end markets. Despite beating earning expectations, the stock sold off in the quarter as estimates for the second quarter were cut slightly. However, the near-term outlook is promising as the stock continues to trade near recent lows and order flow and backlog appear strong.
Unique Fabricating (“UFAB”) is a leading component supplier to the North American auto and industrial end markets. The stock has been weak year-to-date because of a reduced outlook in UFAB’s primary end markets and a cut to their dividend. While this move was unpopular with some income-oriented investors, it will facilitate debt reduction and return the company to compliance with their loan covenants.
BG Staffing (“BGSF”) is a temporary staffing company focused on the clerical, light industrial, IT, finance, and multifamily industries. Increased spending on a three-year technology improvement program has led to reduced earnings estimates. Lowered revenue guidance has also had an impact on analyst expectations, though the stock remains attractively valued.
**Past performance does not guarantee future results. The holdings identified do not represent all the securities purchased, sold or recommended to clients. The top contributors and detractors to return represent those securities that had the largest positive and negative total contribution to the overall portfolio return for the quarter. A complete list of contributors to portfolio return can be obtained by contacting Peter Trumbo, Chief Compliance Officer, at 503-886-8972 or by email at Peter.Trumbo@PacificRidgeCapital.com. For additional information, see the related GIPS® compliant presentation on the last page.
Market Capitalization Analysis
There was a size-bias headwind during the quarter, as larger companies in the Index outperformed smaller companies. Those with a market cap over $400 million in the Index gained 2.2%, versus a gain of 0.1% for companies with a market cap below $400 million. The strategy had 70.6% of its holdings in companies with a market cap below $400 million, compared to 39.6% for the Index.

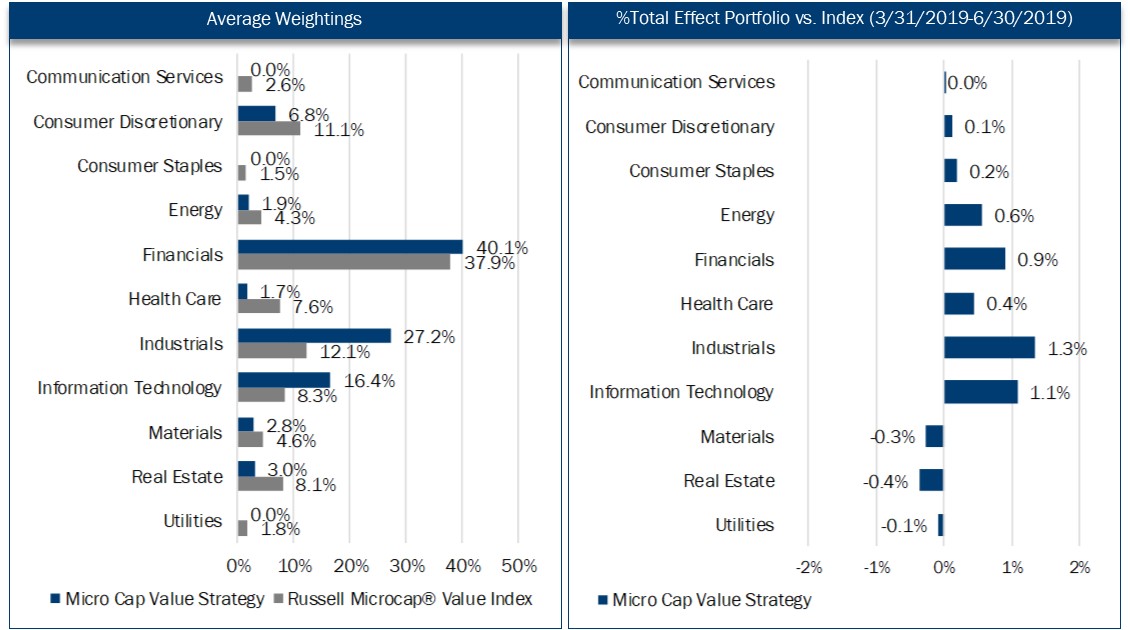
Economic Sector Analysis
The strategy’s performance in Industrials, Information Technology, Financials, Energy, Health Care and Consumer Discretionary contributed approximately 440 basis points of excess return compared to the Index. However, performance in Materials and Real Estate detracted approximately 60 basis points relative to the Index. The strategy’s lack of exposure to the Communication Services and Consumer Staples sectors provided over 20 basis points of excess returns during the quarter, while the lack of exposure to the Utilities sector provided a headwind of almost 10 basis points.
Portfolio Characteristics Top Ten Holdings As of 6/30/2019

Market Outlook
We continue to have a modest growth outlook for the US economy, though pockets of softening data and trade-related uncertainty could lead to choppy activity in the near term. Sentiment amongst purchasing managers remains positive with the June US manufacturing PMI reading of 51.7, the 34th consecutive month of expansion. While new orders dropped to a three-year low, inventories contracted which can signal restocking in the second half of the year. Production and employment remain strong. First quarter 2019 GDP of 3.1% rebounded from the prior quarter and reflected an upturn in government spending and accelerations in inventory investment and exports. However, the cautious business spending climate is expected to cool growth to 2.5% for full year 2019. Corporate profitability and balance sheets remain strong.
Our concerns, given our portfolio positioning, are the potential for an unforeseen near-term economic contraction. We believe uncertainty related to the effects of a global trade war is the greatest risk to growth.
As always, we continue to search for companies that demonstrate an ability to earn a fair return on capital. We welcome any questions or comments you may have and thank you for your continued support.
Sincerely,
Pacific Ridge Capital Partners
Investment Team Additional Professionals
Mark Cooper, CFA® Co-Senior Portfolio Manager Peter Trumbo Chief Operating Officer/Compliance Officer
Dominic Marshall, CFA® Co-Senior Portfolio Manager Mike McDougall Senior Trader
Ryan Curdy, CFA® Portfolio Manager Tammy Wood Director, Marketing & Business Development
Justin McKillip, CFA® Senior Analyst Veronica Orazio Operations Assistant
Adam Boyce, CFA® Senior Analyst
Regulatory Disclosures
The contributors and detractors to return, market capitalization weightings and total effect, economic sector weightings and total effect, portfolio characteristics, and top ten holdings for the Micro Cap Value Composite are based on a representative account within the strategy. The representative account statistics are shown as supplemental information and complement the composite's GIPS® disclosure presentation as provided on the last page.
The Russell Microcap® Value Index measures the performance of the microcap segment of the U.S. equity market. For comparison purposes, the index is fully invested, which includes the reinvestment of income. The return for the index does not include any transaction costs, management fees or other costs. which includes the reinvestment of income. The return for the index does not include any transaction costs, management fees or other costs.
In order to maintain consistency when comparing the Micro Cap Value strategy to the Russell benchmark, the Firm utilizes FactSet’s outlier methodology calculations which provide a comparable portfolio characteristic calculation methodology as Russell applies to its indices.
The information provided should not be considered a recommendation to purchase or sell any particular security. There is no assurance that any securities discussed herein will remain in our strategy at the time you receive this report or that securities sold have not been repurchased. It should not be assumed that any of the holdings discussed herein were or will be profitable or that the investment recommendations or decisions we make in the future will be profitable or will equal the investment performance of the securities discussed herein. Past performance is no guarantee of future results.
Although the statements of fact and data in this report have been obtained from, and are based upon, sources that the Firm believes to be reliable, we do not guarantee their accuracy, and any such information may be incomplete or condensed. All opinions included in this report constitute the Firm’s judgment as of the date of this report and are subject to change without notice. This report is for informational purposes only and is not intended as an offer or solicitation with respect to the purchase or sale of any security.

Disclosures
Pacific Ridge Capital Partners, LLC (“Pacific Ridge”, “PRCP”, or “the Firm”) is a 100% employee owned investment advisor registered with the Securities and Exchange Commission under the Investment Advisors Act of 1940. The Firm was established in June 2010, and has one office located in Lake Oswego, Oregon. Pacific Ridge claims compliance with the Global Investment Performance Standards (GIPS®) and has prepared and presented this report in compliance with the GIPS standards. PRCP has been independently verified for the periods June 10, 2010 through December 31, 2018. Verification assesses whether (1) the Firm has complied with all the composite construction requirements of the GIPS standards on a firm-wide basis and (2) the Firm’s policies and procedures are designed to calculate and present performance in compliance with the GIPS standards. The Micro Cap Value composite has been examined for the periods June 10, 2010 through December 31, 2018. The verification and performance examination reports are available upon request.
The Micro Cap Value composite was created on June 10, 2010. The Micro Cap Value composite comprises fully discretionary portfolios managed by the Firm invested primarily in a concentrated equity portfolio of smaller companies with market capitalizations similar to those found in the Russell Microcap® Index. The strategy ascribes to a disciplined bottom-up fundamental selection process with an emphasis given to the cash flow generating capabilities of a company. The strategy’s objective is to outperform the Russell Microcap® Value Index which is used as our benchmark. Eligible portfolios must be managed for a full calendar month prior to inclusion in the Micro Cap Value composite. Prior to June 10, 2010 the performance represents the track record established by the Portfolio Management Team while affiliated with prior firms. The portability of the prior track record has been reviewed by Ashland Partners & Company LLP. Composite dispersion is measured using an asset weighted standard deviation of returns of the portfolios. Returns and asset values are stated in US dollars.
The Russell Microcap® Value Index measures the performance of the microcap segment of the U.S. equity market. For comparison purposes, the index is fully invested, which includes the reinvestment of income. The return for the index does not include any transaction costs, management fees or other costs.
Sources: Pacific Ridge; FactSet Research Systems (“FactSet”); and Russell Investment Group (“Russell”) who is the source and owner of the Russell Index data.
Returns for the Micro Cap Value composite are presented gross and net of management fees and other expenses and includes realized and unrealized gains and losses, cash and cash equivalents and related interest income, and accrued based dividends. Net returns are calculated by deducting the highest annual management fee of 1.50% from the quarterly gross composite return. All returns are calculated after the deduction of the actual trading expenses incurred during the period.
The management fee is a flat rate of 1.50%.
The portfolio characteristics, sector weightings and attribution analysis for the Micro Cap Value composite are based on a representative account within the strategy. The representative account statistics are shown as supplemental information. The Firm maintains a complete list and description of composites, policies for valuing portfolios, calculating performance, and preparing compliant presentations which are available upon request by contacting Peter Trumbo, Chief Compliance Officer at (503) 886-8972 or Peter.Trumbo@PacificRidgeCapital.com.