

Performance Review
The Pacific Ridge Capital Partners Small Cap Value strategy (the “Strategy”) returned -0.9%* (-1.2% net of fees) during the first quarter ended March 31, 2023, underperforming the Russell 2000® Value Index (the “Index”) return of -0.7%.
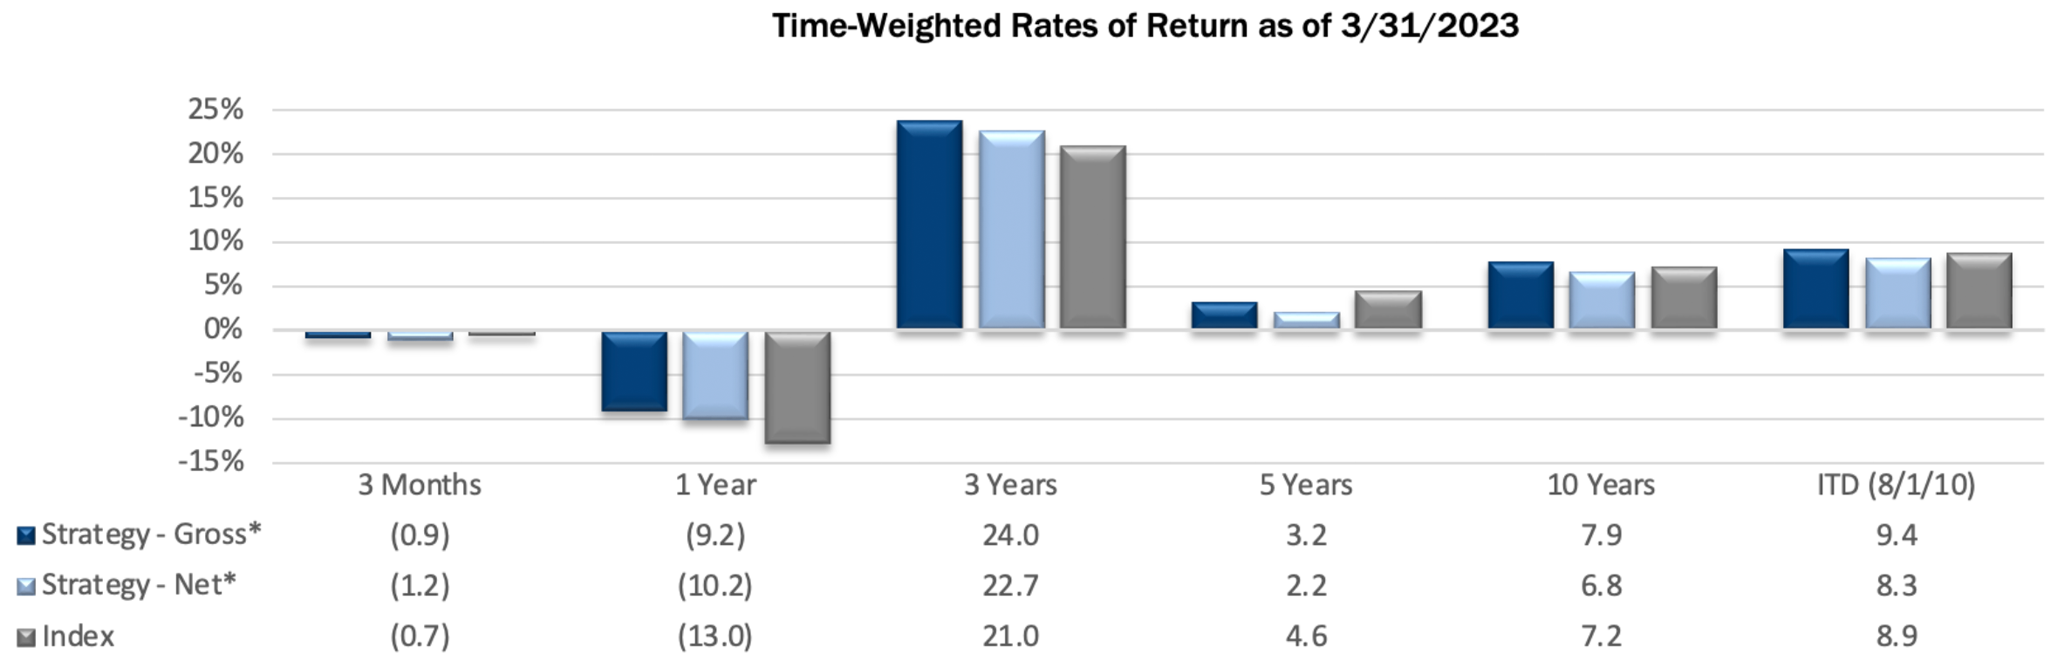
*Preliminary results. For additional performance information, see the related GIPS® Report below.
The Strategy’s portfolio characteristics can be significantly different from the Index because we generally invest in smaller-sized and lower-valued stocks, as well as being sector indifferent. This difference is depicted in the charts below.
Size Analysis
The Strategy faced a moderate size bias headwind during the quarter as smaller companies in the Index underperformed larger companies. Those with a market capitalization below the $801 million Index median posted a -3.2% return, versus a -0.2% return for stocks with a market capitalization above the breakpoint level. The Index had 83.5% of its weight above its median market capitalization level compared to 48.6% in the Strategy.

**The size breakpoint in the chart is based on the Index’s median market capitalization at the beginning of the period.
Style Analysis
The Strategy faced a modest style bias headwind in the quarter from profitable companies (stocks with PEs greater than 0x). This occurred for two reasons. First, the Strategy had a higher weight than the Index in profitable companies with a PE ratio below 15x. Those firms posted the worst return of -2.8% in the Index. Second, the Strategy was underweight in profitable companies that had a PE ratio above 15x. Those stocks posted the best return of 3.0%. The impact from unprofitable companies (stocks with PEs less than 0x) in the quarter was negligible. The Strategy held 5.8% in unprofitable companies compared to the Index weight of 13.8%, and the return of those companies in the Index was -0.5%.

*P/E ratios are based on analyst estimates for the current fiscal year, including both completed and estimated quarterly results. Companies that have no earnings estimates have been excluded, and thus the bars may not add up to 100%.
Sector Analysis
The top two contributing sectors to the Strategy’s performance were Technology and Health Care that on a combined basis had a weighting of 18.6%. Overweighting Technology and the lack of exposure to Health Care resulted in a moderate tailwind. The top two detracting sectors to the Strategy’s performance were Financials and Industrials, with a combined weighting of 50.4%. The primary reasons for the headwind in these two sectors were due to negative stock selection scores that were particularly influenced by the failure of two U.S. regional banks that we do not own. Aside from negative stock selection, being overweight Industrials and underweight Financials, relative to the Index, was a positive factor.

Portfolio Characteristics (as of 3/31/23)

Top Contributors
Top Detractors


Top Contributors
Cooper-Standard (“CPS”) manufactures sealing, fuel, brake delivery and fluid transfer systems for passenger vehicles. The company’s main customer base is large OEMs (Ford, GM, Stellantis), followed by a small business selling products to automotive suppliers. The stock rebounded during the quarter as the company completed its debt refinancing, removed its financial covenants and extended maturities to 2027. With a normalized level of auto production expected in the next several years, CPS should start to generate a healthy amount of cash flow and fetch a higher valuation multiple.
Cohu (“COHU”) is a maker of back-end semiconductor equipment, such as testing and handling equipment. Continuing a recent trend, the stock reacted favorably to results that exceeded expectations this quarter, even though industry conditions have been weak, and will probably continue to be fragile into the first half of 2023. COHU’s 2022 revenue was down nearly 10%, with a similar decline expected in 2023. Long-term demand trends in the industry remain strong, however, as does the company’s market position. Gross margins have been improving per expectations, and operating margins are settling in the healthy mid- to high-teen level.
Asure Software (“ASUR”) is a provider of Human Capital Management (HCM) software and services, specifically in payroll processing and related functions. The stock has posted a significant move up in each of the past two quarters, after reporting organic quarterly revenue growth of 22% and 38% year-over-year. New marketplace options such as credit monitoring for employees of payroll customers, as well as a relatively new human resources compliance offering, are proving to be fruitful add-ons for a maturing sales force to sell into the existing customer base. We have been trimming this position, as the valuation moves more toward a fair level.
Ichor Holdings (“ICHR”) is a key component supplier and outsourced manufacturing partner to the largest semiconductor capital equipment makers. Even though 2023 could be a difficult year for the industry, we expect ICHR to remain profitable and generate significant cash flow. The stock has performed relatively well in anticipation of continued gross margin improvement, driven by the company’s ongoing vertical integration efforts, specifically in its key gas delivery subcomponents. These improvements should generate record profitability and become long-term demand drivers that lead to a return of top-line growth likely by early 2024.
Stagwell (“STGW”) is a global advertising and marketing company. The stock moved higher during the quarter as it reported impressive fourth quarter 2022 earnings. STGW is reaping the benefits of its merger with MDC Partners, reporting ample organic growth in the face of an advertising spending slowdown. While the stock has had a nice run during the quarter, we still believe the stock is trading at an attractive valuation.
Top Detractors
Metropolitan Bank (“MCB”) is a New York City based community bank that has been extremely volatile year-to-date. The stock experienced a significant sell-off when Signature Bancorp was seized by regulators, as both firms had exposure to the crypto industry. While Signature had a far higher concentration of revenue from crypto and a very high percentage of total deposits that were uninsured, MCB’s exit from crypto was nearly complete and had a below-average concentration in uninsured deposits. The stock came under pressure again late in the quarter following the publication of a “short report”, though the stock bounced back somewhat the following day after a business update was provided by management.
Customers Bancorp (“CUBI”) a Pennsylvania-based community bank, sold off during the first quarter (as did most regional banks) due to systematic risk around the bank run at SVB Financial Group. The market is discounting shares because of the uncertainty of a potential contagion bank run, combined with the company’s size and deposit profile. CUBI has not experienced a substantial deposit decline, and our continuing view is that shares are trading around 3x the company’s earnings power. For these reasons, we continue to maintain a position.
Bridgewater Bancshares (“BWB”) is a branch-light bank operating in the suburbs of Minneapolis. The bank reported earnings that missed expectations due to funding pressures in the current rising rate environment. The stock was under further pressure late in the quarter from increased commercial real estate scrutiny. The bank has done an exceptional job over the years by specializing in multifamily lending.
Whole Earth Brands (“FREE”) operates primarily in the alternative sweeteners industry, with a smaller segment focused on flavors and ingredients. The company has struggled over the past year as it works through labor shortages, rising interest rates, streamlining supply chains and shifting production to third parties. A reconstituted management team, led by a new CEO tied to a large outside investor, plans to spend the next year turning the business around.
ConnectOne Bancorp (“CNOB”) is a business-focused community bank headquartered in the NYC suburbs of New Jersey. The stock came under pressure late in the quarter following the failures of SVB Financial Group and Signature Bancorp. Additionally, increased focus on commercial real estate lending exposure put pressure on CNOB shares because the company has an above average concentration in this area. The bank has a history of solid underwriting, and the company made it through the prior financial crisis in far better condition than its peers. We anticipate similar results as the current banking situation plays out.
Market Outlook
Despite a turbulent first quarter characterized by the Federal Reserve’s (the “Fed”) commitment to aggressive rate hikes and a banking sector crisis, US equities remained surprisingly stable. Investors responded by swiftly shifting from value stocks to growth stocks, speculating that the Fed might slow or pause its rate hikes to promote financial stability and in response to reports of slowing inflation.
As expected, the Fed increased its key short-term interest rate by 25 basis points on March 22, bringing it to a range of 4.75% to 5.00%. The current yield curve is extremely inverted, a traditional sign of potential economic recession. Specifically, the spread between the 10-year and 3-month Treasury is inverted by 120 basis points, which is a cause for concern.
In February, the Core Personal Consumption Expenditure Index (the Fed’s preferred measure of inflation) rose by 4.6% on an annualized basis. Although this is slightly lower than January’s reading of 4.7%, it is still well above the central bank’s target of two percent. It is important to note that the inflation reading for March will factor into recent stresses in the banking system, and that could have implications for future Fed policy decisions.
GDP increased 2.6% in the fourth quarter of 2022, driven by increased private inventory investment in the manufacturing, mining and construction sectors, as well as growth in consumer spending (particularly in service-related industries). While first quarter 2023 GDP growth is expected to remain positive, various leading indicators point to slower/negative growth later in the year. Additionally, sentiment amongst purchasing managers continues to weaken. The March 2023 US Purchasing Managers’ Index (“PMI”) reading was 46.3, the fifth consecutive monthly reading below 50 and the lowest since the initial Covid lockdowns. Most PMI sub-components, including New Orders and Production, remain depressed, while Inventories appear to show early signs of contracting and Employment expectations are beginning to roll over.
We continue to have a modest growth outlook for the US economy over our investment horizon. That said, recent stress in the banking system, the extremely inverted yield curve and stubborn inflationary pressures have created near-term uncertainty.
PRCP GIPS Report

*Information is not statistically meaningful due to an insufficient number of portfolios in the composite for the entire year.
Disclosures
Pacific Ridge Capital Partners, LLC (“Pacific Ridge”, “PRCP”, or “the Firm”) is a 100% employee owned investment advisor registered with the Securities and Exchange Commission under the Investment Advisors Act of 1940. The Firm was established in June 2010, and has one office located in Lake Oswego, Oregon. Pacific Ridge claims compliance with the Global Investment Performance Standards (GIPS®) and has prepared and presented this report in compliance with the GIPS standards. Pacific Ridge has been independently verified for the periods June 10, 2010 through December 31, 2022. A firm that claims compliance with the GIPS standards must establish policies and procedures for complying with all the applicable requirements of the GIPS standards. Verification provides assurance on whether the firm’s policies and procedures related to composite and pooled fund maintenance, as well as the calculation, presentation, and distribution of performance, have been designed in compliance with the GIPS standards and have been implemented on a firm-wide basis. The Small Cap Value composite has had a performance examination for the periods June 10, 2010 through December 31, 2022. The verification and performance examination reports are available upon request.
The Small Cap Value composite was created and incepted on August 1, 2010. The Small Cap Value composite comprises fully discretionary portfolios managed by the Firm invested primarily in an equity portfolio of small companies with market capitalizations similar to those found in the bottom three-quarters of the Russell 2000® Index. Smaller capitalization equities have historically had greater volatility than large capitalization equities. The Strategy ascribes to a disciplined bottom-up fundamental selection process with an emphasis given to the cash flow generating capabilities of a company. The Strategy’s objective is to outperform the Russell 2000 Value Index which is used as our benchmark. Eligible portfolios must be managed for a full calendar month prior to inclusion in the Small Cap Value composite. Composite dispersion is measured using an asset weighted standard deviation of gross returns of the portfolios included for the entire year. Returns and asset values are stated in US dollars.
The Russell 2000 Value Index measures the performance of the Russell 2000 companies with lower price-to-book ratios and lower forecasted growth values. For comparison purposes, the Index is fully invested, which includes the reinvestment of income. The return for the Index does not include any transaction costs, management fees or other costs. It is not possible to invest directly in the Index.
Sources: Pacific Ridge; FactSet Research Systems (“FactSet”); and Russell Investment Group (“Russell”) who is the source and owner of the Russell Index data.
Returns for the Small Cap Value composite are time-weighted and presented gross and net of management fees and other expenses and includes realized and unrealized gains and losses, cash and cash equivalents and related interest income, and accrued based dividends. Net returns are calculated by deducting the highest annual management fee of 1.00% from the quarterly gross composite return. Performance-based fees are available upon request. All returns are calculated after the deduction of the actual trading expenses incurred during the period.
The fee schedule for separately managed accounts is a flat rate of 1.00%.
The portfolio characteristics, sector weightings and attribution analysis for the Small Cap Value composite are based on a representative account within the Strategy. The representative account statistics are shown as supplemental information. The Firm maintains a complete list of contributors and detractors to portfolio return as well as a complete list and description of composites and pooled funds, policies for valuing portfolios, calculating performance, and preparing GIPS Reports, all of which are available upon request by contacting Peter Trumbo, Chief Operating Officer/Chief Compliance Officer at (503) 886-8972 or Peter.Trumbo@PacificRidgeCapital.com.
GIPS is a registered trademark of CFA Institute. CFA Institute does not endorse or promote this organization, nor does it warrant the accuracy or quality of the content contained herein.
Top and Bottom Performing Securities represent those security holdings that had the largest positive and negative total contribution to the portfolio return for the quarter. Top and Bottom Economic Sectors represent those sectors that had the largest positive and negative total contribution to the portfolio return. The holdings identified do not represent all the securities purchased, sold or recommended to clients.
In order to maintain consistency when comparing the Small Cap Value strategy to the Russell benchmark, the Firm utilizes FactSet’s outlier methodology calculations which provide a comparable portfolio characteristic calculation methodology as Russell applies to its indices.
The information provided should not be considered a recommendation to purchase or sell any particular security. There is no assurance that any securities discussed herein will remain in our Strategy at the time you receive this report or that securities sold have not been repurchased. It should not be assumed that any of the holdings discussed herein were or will be profitable or that the investment recommendations or decisions we make in the future will be profitable or will equal the investment performance of the securities discussed herein. Past performance is no guarantee of future results.
Although the statements of fact and data in this report have been obtained from, and are based upon, sources that the Firm believes to be reliable, we do not guarantee their accuracy, and any such information may be incomplete or condensed. All opinions included in this report constitute the Firm’s judgment as of the date of this report and are subject to change without notice. This report is for informational purposes only and is not intended as an offer or solicitation with respect to the purchase or sale of any security.
| Investment Team | Other Professionals | |||
| Mark Cooper, CFA® | Co-Senior Portfolio Manager | Peter Trumbo | Chief Operating Officer/Chief Compliance Officer | |
| Dominic Marshall, CFA® | Co-Senior Portfolio Manager | Mike McDougall | Senior Trader | |
| Ryan Curdy, CFA® | Portfolio Manager | Manisha Thakkar, CFA® | Director of Business Development | |
| Justin McKillip, CFA® | Senior Analyst | Veronica Orazio | Operations Assistant | |
| Adam Wilke, CFA® | Senior Analyst | |||
| Laura Moon | Analyst |
Special Announcement
We are pleased to announce that as of June 30, 2023, Dominic Marshall will be the sole Senior Portfolio Manager on both the Micro Cap Value and Small Cap Value strategies.
Mark Cooper will continue in his role as President and remain a Portfolio Manager and contributing analyst on both strategies. He will also be assisting with marketing and business/product development.
If you would like to discuss these changes, or if you have questions on any other topics, please don’t hesitate in contacting us. We look forward to hearing from you.