

Q1’21 Micro Cap Value Strategy
Market Commentary
As we enter the second quarter, the economy continues to emerge from the deepest economic contraction ever recorded. While the recovery has been faster and stronger than anyone expected, questions still remain about the path forward.
Prior to COVID-19, there had only been one global pandemic in the last century that coincided with a recession: the 1957 outbreak of Asian flu. Though the economy did enter a brief recession at the beginning of that pandemic, the downturn is generally attributed to weakness in the automotive industry, not to the disease. Of interest to note is the 1918 Spanish flu, which is often compared to the current COVID-19 pandemic. Though 675,000 Americans died (0.67% of the US population) and 20 million perished globally, the stock market and economy continued to grow despite the massive loss of life.
Given the high mortality rate and the extremely contagious nature of COVID-19, economic impacts were inevitable. Even after an initial period of societal behavior adjustments, the advent of sufficient testing capacity and a better understanding of COVID’s transmission modes, sectors of the economy remained greatly impacted. The resulting 31.4% decline in GDP prompted a strong legislative and monetary response that helped lead to a recovery in economic activity that may soon reach pre-pandemic levels, as well as a stunning rally in equity markets.
The stimulus package passed last spring (plus additional payments since then) is widely credited for the increase in consumer spending. However, less visible regulatory actions also played a dramatic role in the economic recovery. First, banking regulators permitted the deferral of principal and interest payments on loans without penalizing the banks or borrowers. This provided much needed debt relief to both parties and avoided a surge in distressed loans and bankruptcies. It also headed off further disruption in several key industries.
Second, foreclosure and eviction moratoriums provided indirect relief to countless families, helping them avoid the cost and stress of finding new housing in the middle of a deadly pandemic. This had the added benefit of allowing millions of people to focus their scarce dollars on critical needs, keeping money flowing into essential goods and services.
As we look forward to the remainder of this year, we see continued organic acceleration of the economy as Americans look to leave their homes and start traveling, dining out and safely socializing with others. As investors with a time horizon longer than most, we are looking ahead to the 2022 landscape. While society should return to relative normalcy, the cessation of the policies, stimulus payments and regulations that helped initiate the recovery will likely have future negative ramifications.
There are other competing trends that we see on the economic horizon: the potential of new tax legislation, a repeal of the SALT provision (a tailwind in high-tax states), an increase to the corporate tax rate (an immediate earnings headwind for most profitable publicly traded companies) and the passage of an infrastructure bill (likely a tailwind). All of these offsetting factors will provide a challenging backdrop for economic forecasters as we enter the back half of 2022.

*Preliminary results. For additional performance information, see the related GIPS® Report on the last page
Strategy Review
The Pacific Ridge Capital Partners’ Micro Cap Value strategy returned 26.0%* during the first quarter of 2021, underperforming the 29.4% return of the Russell Microcap® Value Index (“Index”). Over the trailing one-, three- and five-year periods, the strategy returned 101.6%*, 9.1%* and 16.6%* (annualized), respectively, compared to the Index returns of 115.4%, 13.5% and 17.1%. Since inception on April 1, 2007, the strategy has returned 11.4%* annually versus 7.3% for the Index.
*Preliminary results. For additional performance information, see the related GIPS® Report on the last page
Top Contributors and Detractors to Return for First Quarter 2021**

Top Contributors
Amtech Systems (“ASYS”), a manufacturer of semiconductor capital equipment, rallied strongly during the quarter, driven by bullish commentary from management and an earnings report that exceeded expectations. The company is benefiting from strong demand drivers and a lack of capacity in the semiconductor industry, especially for automotive-related applications. The balance sheet is exceptionally strong after disposition of their legacy solar business, with $4.00 per share in net cash.
Rimini Street (“RMNI”) is a provider of support and services for enterprise software. The company broadened its shareholder base during the quarter through a secondary offering and set the stage to pay off high-cost legacy financings. The stock rallied early in the quarter and the company hosted its first ever Analyst Day. Management sounds increasingly confident in their ability to win new business and aggressively grow revenue through an expanded sales force and new service offerings.
Acacia Research (“ACTG”), an acquirer of patent technologies, has performed very well over the past year following a fortuitous investment by management seeking to monetize net operating loss carryforwards. The company acquired a portfolio of distressed investments last spring, most of which have rebounded much stronger than expected. As a result, ACTG’s valuation is now based on the sum of its varied parts, while the underlying patent litigation business continues to operate.
CRH Holdings (“CRHM”) is an anesthesia provider serving gastroenterology clinics. The stock performed well during the quarter following the company’s agreement to be acquired by WELL Health. The core anesthesia business was significantly impacted by COVID-19, as clinics using CRHM’s services were forced to close or curtail their procedures. This resulted in a substantial shortfall to expected cash flow. We exited our position during the quarter following the announcement of their pending acquisition.
Shyft Group (“SHYF”), a manufacturer of commercial vehicles, has seen its stock nearly triple from its lows in 2020. With the shift to online shopping over the past year, demand for delivery vehicles has increased dramatically. Estimates have steadily moved higher as analysts raised their expectations for both sales and EBITDA margins heading into 2021 and 2022. The company recently reduced their debt following the sale of a non-core business, resulting in a very strong balance sheet with high levels of cash flow projected in the coming years.
Top Detractors
Lifetime Brands (“LCUT”) is a manufacturer of kitchenware and tableware products. The stock traded roughly flat during the quarter despite beating earnings expectations on strong sales in their core kitchenware and cutlery business. Margins were down slightly as the company dealt with an unfavorable product mix. Also, comparing the first quarter of 2021 with its pandemic woes with the first quarter of 2020, where company earnings were very strong, weighed on traders. Despite these factors, the stock remains inexpensive as investors eagerly await management to release full-year guidance in the coming quarter.
Zovio (“ZVO”), a provider of postsecondary education services, traded down late in the quarter following the nomination of a new Under Secretary of Education believed to be unfriendly to the for-profit education industry. The resignation of the founder and CEO late in the quarter also led to selling pressure. Zovio no longer operates a university and currently generates a majority of its revenue from outsourced services provided to the University of Arizona. These two factors will likely shield ZVO from the impact of any proposed regulations.
Landec (“LNDC”) is a designer and manufacturer of differentiated health and wellness products for the food and biomaterials markets. The company has been transitioning its business segments to operate on a standalone basis, believing that this change could potentially unlock hidden value. As part of the separation process, LNDC is working on a turnaround of their largest segment which is beginning to gain traction. The company should begin to see steady revenue growth as the headwinds from COVID-19 begin to fade during the latter half of the year.
Unity Bancorp (“UNTY”) is a community bank headquartered in New Jersey. The stock was added to the strategy fairly late in the quarter because it trades at a material discount to its peers. The bank has very strong fundamentals in a market that is benefiting from migration out of New York City. The company hired a new CFO, stabilizing the management team, though the possibility of an eventual sale of the bank in the coming years remains.
Natural Gas Services (“NGS”) is a provider of compression equipment to the oilfield industry. The stock was down slightly during the quarter as the company continues to be impacted by lower spending from its energy customers. NGS has strengthened its cash-rich balance sheet during the downturn via harvesting working capital. We are encouraged by the company’s steady traction into the higher-horsepower compression market and the fact that NGS shares are trading at a significant discount to tangible book value.
**Past performance does not guarantee future results. The holdings identified do not represent all the securities purchased, sold or recommended to clients. Top contributors and detractors to return represent those securities that had the largest positive and negative total contribution to the overall portfolio return for the quarter. A complete list of contributors to portfolio return can be obtained by contacting Peter Trumbo, Chief Compliance Officer, at 503-886-8972 or by email at Peter.Trumbo@PacificRidgeCapital.com. For additional information, see the related GIPS® Report on the last page.
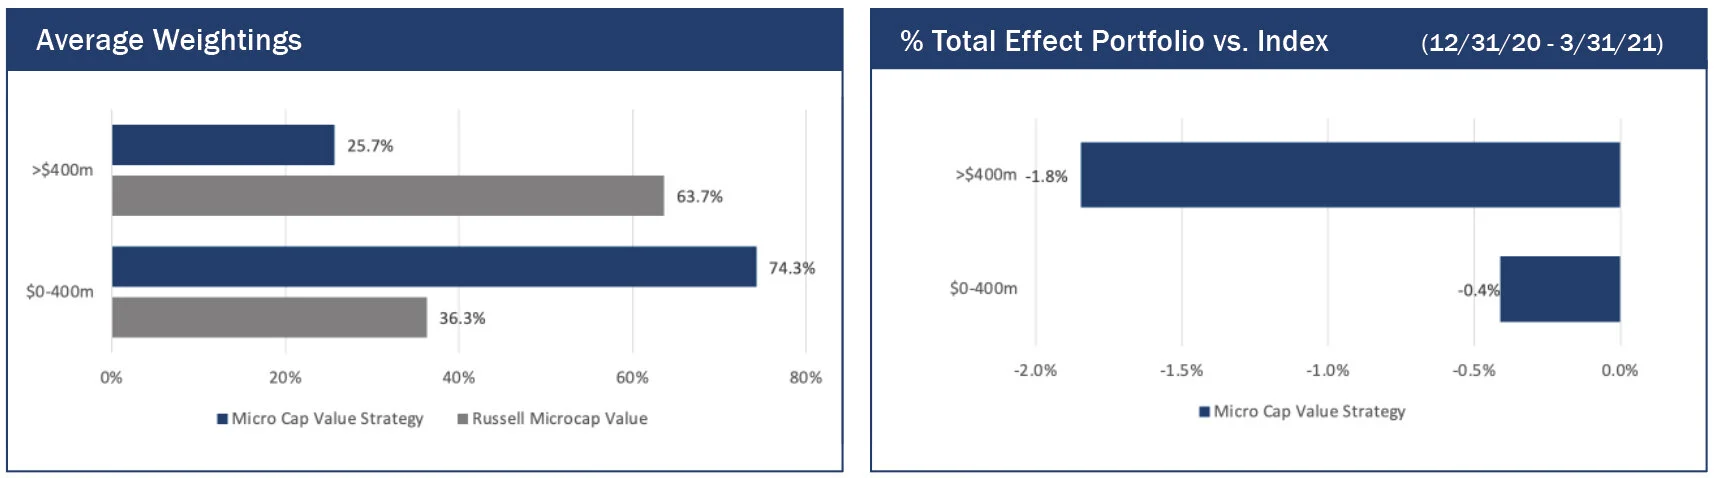
Market Capitalization Analysis
There was a moderate size bias headwind during the quarter, as larger companies in the Index outperformed smaller companies. Those with a market cap over $400 million in the Index returned 30.7%, versus a gain of 27.2% for firms with a market cap below $400 million. The strategy had 74.3% of its holdings in companies with a market cap below $400 million, compared to 36.3% for the Index.

Style Analysis
There was a slight value-bias tailwind for profitable companies during the quarter, as stocks with lower PEs outperformed those with higher PEs. Those with a PE ratio greater than 15x returned 24.1% versus 27.1% for those companies with a PE below 15x. The strategy had 27.9% of its holdings in companies with a PE greater than 15x compared to 29.0% for the Index. Strong performance of unprofitable companies in the Index created a more significant headwind, as those stocks returned 47.9%, versus a gain of 25.8% for firms that were profitable. The strategy had 10.5% of its holdings in unprofitable companies, compared to 23.8% for the Index.
Economic Sector Analysis
The strategy’s performance in Information Technology contributed 345 basis points of excess return compared to the Index. However, performance in Consumer Discretionary detracted 500 basis points versus the Index. More specifically, strong performance in GameStop (“GME”), which we do not own, detracted 425 basis points of performance. The strategy’s lack of exposure to the Communication Services, Consumer Staples, and Utilities sectors provided 35 basis points of excess returns during the quarter.

Market Outlook
We are optimistic for continued growth in the US economy in the near term, driven by another round of fiscal stimulus and greater availability of vaccines. On the heels of 4.3% growth in 4Q20 GDP, expectations for an economic rebound in the US have improved. Sentiment amongst purchasing managers remained positive for the tenth consecutive month, and the March 2021 reading of 64.7 was the highest level in nearly forty years. While strength in new orders and production suggest that growth trends will continue to persist, we are mindful of potential supply chain bottlenecks that could slow the system.

As always, we continue to search for companies that demonstrate an ability to earn a fair return on capital. We welcome any questions or comments you may have and thank you for your continued support.
Sincerely,
Pacific Ridge Capital Partners
Investment Team Additional Professionals
Mark Cooper, CFA® Co-Senior Portfolio Manager Peter Trumbo Chief Operating Officer/Compliance Officer
Dominic Marshall, CFA® Co-Senior Portfolio Manager Mike McDougall Senior Trader
Ryan Curdy, CFA® Portfolio Manager Veronica Orazio Operations Assistant
Justin McKillip, CFA® Senior Analyst
Adam Boyce, CFA® Senior Analyst
Regulatory Disclosures
The contributors and detractors to return, market capitalization weightings and total effect, economic sector weightings and total effect, portfolio characteristics, and top ten holdings for the Micro Cap Value Composite are based on a representative account within the strategy. The representative account statistics are shown as supplemental information and complement the composite's GIPS® Report as provided on the last page.
The Russell Microcap® Value Index measures the performance of the microcap segment of the U.S. equity market. For comparison purposes, the index is fully invested, which includes the reinvestment of income. The return for the index does not include any transaction costs, management fees or other costs.
In order to maintain consistency when comparing the Micro Cap Value strategy to the Russell benchmark, the Firm utilizes FactSet’s outlier methodology calculations which provide a comparable portfolio characteristic calculation methodology as Russell applies to its indices.
The information provided should not be considered a recommendation to purchase or sell any particular security. There is no assurance that any securities discussed herein will remain in our strategy at the time you receive this report or that securities sold have not been repurchased. It should not be assumed that any of the holdings discussed herein were or will be profitable or that the investment recommendations or decisions we make in the future will be profitable or will equal the investment performance of the securities discussed herein. Past performance is no guarantee of future results.
Although the statements of fact and data in this report have been obtained from, and are based upon, sources that the Firm believes to be reliable, we do not guarantee their accuracy, and any such information may be incomplete or condensed. All opinions included in this report constitute the Firm’s judgment as of the date of this report and are subject to change without notice. This report is for informational purposes only and is not intended as an offer or solicitation with respect to the purchase or sale of any security.
PRCP GIPS Report

Disclosures
Pacific Ridge Capital Partners, LLC (“Pacific Ridge”, “PRCP”, or “the Firm”) is a 100% employee owned investment advisor registered with the Securities and Exchange Commission under the Investment Advisors Act of 1940. The Firm was established in June 2010, and has one office located in Lake Oswego, Oregon. Pacific Ridge claims compliance with the Global Investment Performance Standards (GIPS®) and has prepared and presented this report in compliance with the GIPS standards. Pacific Ridge has been independently verified for the periods June 10, 2010 through December 31, 2020. A firm that claims compliance with the GIPS standards must establish policies and procedures for complying with all the applicable requirements of the GIPS standards. Verification provides assurance on whether the firm’s policies and procedures related to composite and pooled fund maintenance, as well as the calculation, presentation, and distribution of performance, have been designed in compliance with the GIPS standards and have been implemented on a firm-wide basis. The Micro Cap Value Composite has had a performance examination for the periods June 10, 2010 through December 31, 2020. The verification and performance examination reports are available upon request.
The Micro Cap Value composite was created on June 10, 2010 and incepted on April 1, 2007. The Micro Cap Value composite comprises fully discretionary portfolios managed by the Firm invested primarily in a concentrated equity portfolio of smaller companies with market capitalizations similar to those found in the Russell Microcap® Index. The strategy ascribes to a disciplined bottom-up fundamental selection process with an emphasis given to the cash flow generating capabilities of a company. The strategy’s objective is to outperform the Russell Microcap® Value Index which is used as our benchmark. Eligible portfolios must be managed for a full calendar month prior to inclusion in the Micro Cap Value composite. Prior to June 10, 2010 the performance represents the track record established by the Portfolio Management Team while affiliated with prior firms. The portability of the prior track record has been reviewed by Ashland Partners & Company LLP. Composite dispersion is measured using an asset weighted standard deviation of gross returns of the portfolios included for the entire year. Returns and asset values are stated in US dollars.
The Russell Microcap® Value Index measures the performance of the microcap segment of the U.S. equity market. For comparison purposes, the index is fully invested, which includes the reinvestment of income. The return for the index does not include any transaction costs, management fees or other costs.
Sources: Pacific Ridge; FactSet Research Systems (“FactSet”); and Russell Investment Group (“Russell”) who is the source and owner of the Russell Index data.
Returns for the Micro Cap Value composite are presented gross and net of management fees and other expenses and includes realized and unrealized gains and losses, cash and cash equivalents and related interest income, and accrued based dividends. Net returns are calculated by deducting the highest annual management fee of 1.50% from the quarterly gross composite return. Performance-based fees are available upon request. All returns are calculated after the deduction of the actual transaction costs incurred during the period. The management fee schedule and total expense ratio for the Micro Cap Value Fund, which is included in the composite, are 1.50% on all assets and 1.68%, respectively, as of the most recent audit. Total fees for the fund may not exceed 1.75% annually.
The fee schedule for separately managed accounts is a flat rate of 1.50%.
The portfolio characteristics, sector weightings and attribution analysis for the Micro Cap Value composite are based on a representative account within the strategy. The representative account statistics are shown as supplemental information. The Firm maintains a complete list and description of composites and pooled funds, policies for valuing portfolios, calculating performance, and preparing GIPS Reports which are available upon request by contacting Peter Trumbo, Chief Compliance Officer at (503) 886-8972 or Peter.Trumbo@PacificRidgeCapital.com.
GIPS® is a registered trademark of CFA Institute. CFA Institute does not endorse or promote this organization, nor does it warrant the accuracy or quality of the content contained herein.
Top 5 and Bottom 5 Performing Securities represent those security holdings that had the largest positive and negative total contribution to the portfolio return. Top 3 and Bottom 3 Economic Sectors represent those sectors that had the largest positive and negative total contribution to the portfolio return.
In order to maintain consistency when comparing the Micro Cap Value strategy to the Russell benchmark, the Firm utilizes FactSet’s outlier methodology calculations which provide a comparable portfolio characteristic calculation methodology as Russell applies to its indices.
The information provided should not be considered a recommendation to purchase or sell any particular security. There is no assurance that any securities discussed herein will remain in our strategy at the time you receive this report or that securities sold have not been repurchased. It should not be assumed that any of the holdings discussed herein were or will be profitable or that the investment recommendations or decisions we make in the future will be profitable or will equal the investment performance of the securities discussed herein. Past performance is no guarantee of future results.
Although the statements of fact and data in this report have been obtained from, and are based upon, sources that the Firm believes to be reliable, we do not guarantee their accuracy, and any such information may be incomplete or condensed. All opinions included in this report constitute the Firm’s judgment as of the date of this report and are subject to change without notice. This report is for informational purposes only and is not intended as an offer or solicitation with respect to the purchase or sale of any security.